Kalman filter, nothing more

Project description
minkf - minimal Kalman filter in Python
Kalman filter/smoother, nothing more. A minimal implementation with only numpy dependency. No fancy classes, just simple functions.
Estimates the states of the system

Calculates also the likelihood of the data, in case one wants to do some hyperparameter tuning. One can also sample from the posterior distribution of the states.
Installation
pip install minkf
Example
The example does some plots via matplotlib, which is not listed as a dependency in order to keep them minimal. Thus, install matplotlib on top of minkf to get the plots working.
The example is about fitting an existing batch of data. For on-line Kalman filtering, check the minkf.kf_predict and minkf.kf_update functions in the package.
For more examples as jupyter notebooks, check the demos folder.
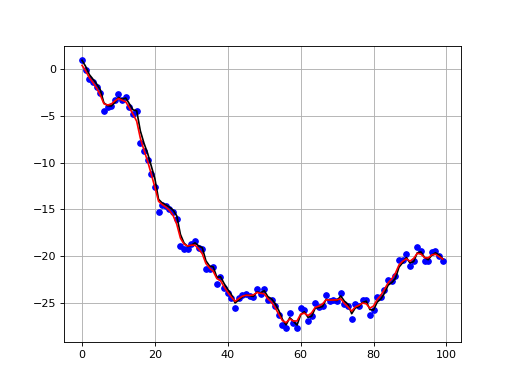
Reconstructing random 1d data
The first example just generates some 1d random walk data and reconstructs it with Kalman filter/smoother. The forward and observation models are just identities. The user can either give the model and error covariance matrices as lists, which enable using different values for each time step. If the matrices are given as constant numpy arrays, the same matrices are used for every time step.
import numpy as np
import minkf as kf
import matplotlib.pyplot as plt

y = np.cumsum(np.random.standard_normal(100))

x0 = np.array([0.0])
Cest0 = 1*np.array([[1.0]])

M = np.array([[1.0]])
K = np.array([[1.0]])
Q = 0.1*np.array([[1.0]])
R = 0.1*np.array([[1.0]])

res = kf.run_filter(y, x0, Cest0, M, K, Q, R, likelihood=True)
res_smo = kf.run_smoother(y, x0, Cest0, M, K, Q, R)

plt.figure()
plt.plot(y, 'bo', ms=5)
plt.plot(res['x'], 'k-')
plt.plot(res_smo['x'], 'r-')
plt.grid(True)
plt.show()
Result is a dict that contains the estimated states and the filtering/smoothing covariances. If likelihood=True is chosen in the filter, the result structure also contains the log-likelihood of the data given the model. This can be useful in, e.g., estimating hyperparameters: one could run the Kalman filter repeatedly via an optimizer or MCMC sampler, for instance.
res['loglike']
297.0302824838724
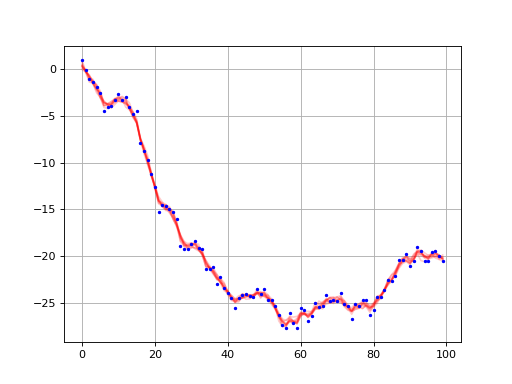
Sampling from the posterior of the states given all the data can be done via the sample function. Sampling needs the Kalman filter results and the dynamics model matrix and model error covariance.
samps = kf.sample(res, M, Q, nsamples=10)

plt.figure()
plt.plot(np.array(samps).T, 'r-', alpha=0.2)
plt.plot(y, 'bo', ms=2)
plt.grid(True)
plt.show()
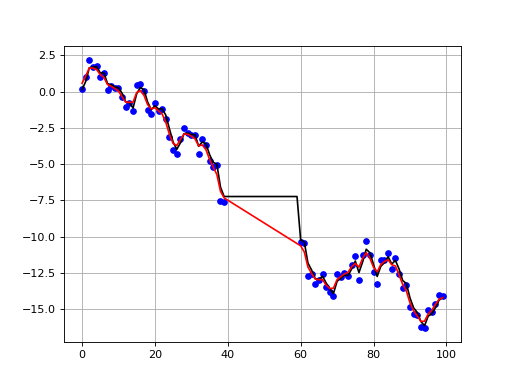
Missing observations
If any element of the observation vector is np.nan, the observation is considered missing. Below is the above simple example with some missing observations in the middle.
y_missing = y.copy()
y_missing[40:60] = np.nan

res_missing = kf.run_filter(y_missing, x0, Cest0, M, K, Q, R, likelihood=True)
res_smo_missing = kf.run_smoother(y_missing, x0, Cest0, M, K, Q, R)

plt.figure()

plt.plot(y_missing, 'bo', ms=5)
plt.plot(res_missing['x'], 'k-')
plt.plot(res_smo_missing['x'], 'r-')
plt.grid(True)
plt.show()
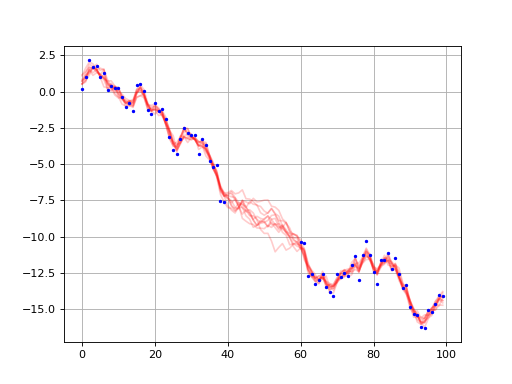
samps_missing = kf.sample(res_missing, M, Q, nsamples=10)

plt.figure()
plt.plot(np.array(samps_missing).T, 'r-', alpha=0.2)
plt.plot(y_missing, 'bo', ms=2)
plt.grid(True)
plt.show()


Download files
Download the file for your platform. If you're not sure which to choose, learn more about installing packages.


