Compare results from simulations with observations.


Project description

ModelSkill: Flexible Model skill evaluation.


ModelSkill is a python package for scoring MIKE models (other models can be evaluated as well).
Contribute with new ideas in the discussion, report an issue or browse the documentation. Access observational data (e.g. altimetry data) from the sister library WatObs.
Use cases
ModelSkill would like to be your companion during the different phases of a MIKE modelling workflow.
- Model setup - exploratory phase
- Model calibration
- Model validation and reporting - communicate your final results
Installation
From pypi:
> pip install modelskill
Or the development version:
> pip install https://github.com/DHI/modelskill/archive/main.zip
Example notebooks
- Hydrology_Vistula_Catchment.ipynb
- Metocean_multi_model_comparison.ipynb
- Multi_variable_comparison.ipynb
- Metocean_track_comparison_global.ipynb
- Gridded_NetCDF_ModelResult.ipynb
- Directional_data_comparison.ipynb
- Combine_comparers.ipynb
Workflow
- Define ModelResults
- Define Observations
- Match Observations and ModelResults
- Do plotting, statistics, reporting using the Comparer
Read more about the workflow in the getting started guide.
Example of use
Start by defining model results and observations:
>>> import modelskill as ms
>>> mr = ms.DfsuModelResult("HKZN_local_2017_DutchCoast.dfsu", name="HKZN_local", item=0)
>>> HKNA = ms.PointObservation("HKNA_Hm0.dfs0", item=0, x=4.2420, y=52.6887, name="HKNA")
>>> EPL = ms.PointObservation("eur_Hm0.dfs0", item=0, x=3.2760, y=51.9990, name="EPL")
>>> c2 = ms.TrackObservation("Alti_c2_Dutch.dfs0", item=3, name="c2")
Then, connect observations and model results, and extract data at observation points:
>>> cc = ms.match([HKNA, EPL, c2], mr)
With the comparer object, cc, all sorts of skill assessments and plots can be made:
>>> cc.skill().round(2)
               n  bias  rmse  urmse   mae    cc    si    r2
observation
HKNA         385 -0.20  0.35   0.29  0.25  0.97  0.09  0.99
EPL           66 -0.08  0.22   0.20  0.18  0.97  0.07  0.99
c2           113 -0.00  0.35   0.35  0.29  0.97  0.12  0.99
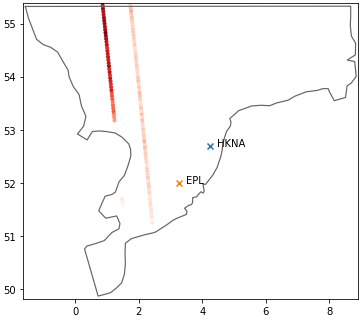
Overview of observation locations
ms.plotting.spatial_overview([HKNA, EPL, c2], mr, figsize=(7,7))
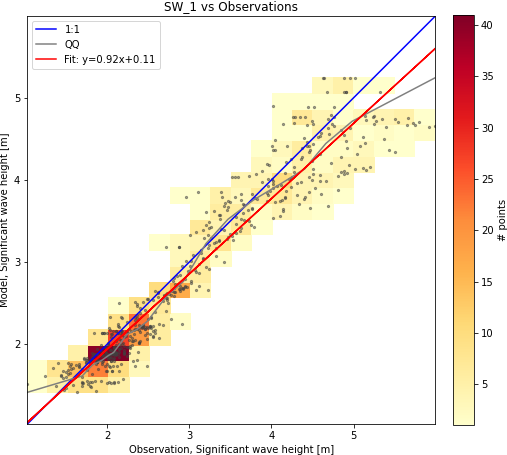
Scatter plot
cc.plot.scatter()
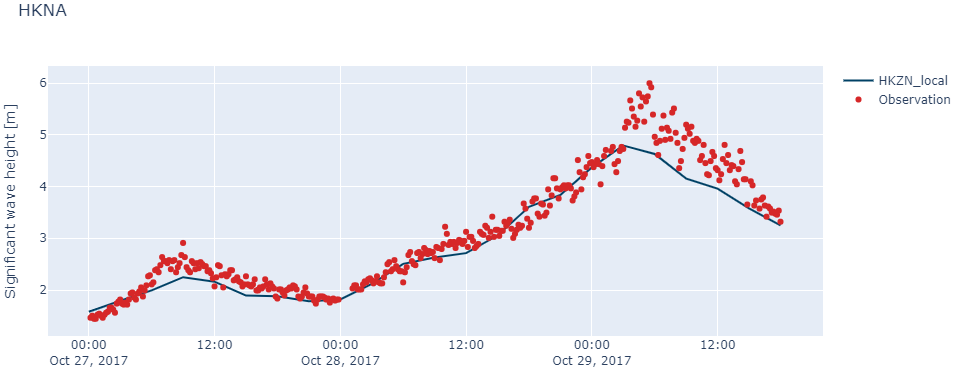
Timeseries plot
Timeseries plots can either be static and report-friendly (matplotlib) or interactive with zoom functionality (plotly).
cc["HKNA"].plot.timeseries(width=1000, backend="plotly")
Release history Release notifications | RSS feed


Download files
Download the file for your platform. If you're not sure which to choose, learn more about installing packages.
Source Distribution
Built Distribution
Hashes for modelskill-1.0.0-py3-none-any.whl
| Algorithm | Hash digest | |
|---|---|---|
| SHA256 | 2b1fa800f7791d28cee5350beeefa910f3fb6fc51e8d83dfaaf5cb0f914f6417 |
|
| MD5 | 1513c21e9f497393a9771eee0946d76c |
|
| BLAKE2b-256 | 97c1d4865a842a6760ec806ade3c3dd1c0543c0330c9b382edfec79b0642da11 |


