Web dashboard for Optuna.


Project description
optuna-dashboard
Realtime Web dashboard for Optuna. Code files were originally taken from Goptuna.
Usage
You can install optuna-dashboard via pip.
$ pip install optuna-dashboard
After you installed, optuna-dashboard command is available.
Please execute it with Optuna storage URL.
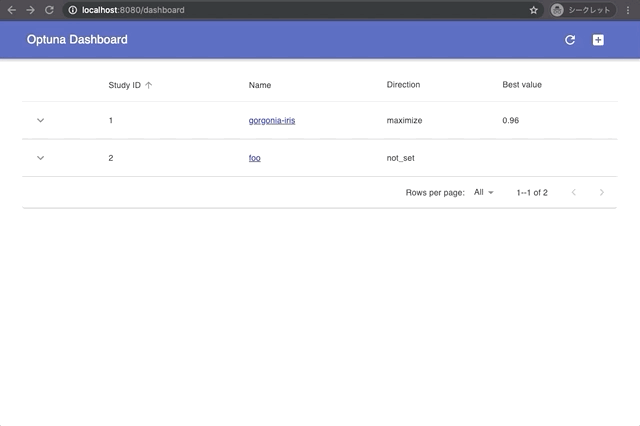
$ optuna-dashboard sqlite:///db.sqlite3
Bottle v0.12.18 server starting up (using WSGIRefServer())...
Listening on http://localhost:8080/
Hit Ctrl-C to quit.
More command line options
$ optuna-dashboard --help
usage: optuna-dashboard [-h] [--port PORT] [--host HOST] [--quiet] storage

A third-party dashboard for optuna.

positional arguments:
  storage      Optuna Storage URL

optional arguments:
  -h, --help   show this help message and exit
  --port PORT  port number (default: 8080)
  --host HOST  hostname (default: 'localhost')
  --quiet      quiet
Alternatives
- optdash: a third-party dashboard for optuna.
Release history Release notifications | RSS feed


Download files
Download the file for your platform. If you're not sure which to choose, learn more about installing packages.
Source Distribution
optuna-dashboard-0.0.1.tar.gz
(1.2 MB
view hashes)
Built Distribution
Close
Hashes for optuna_dashboard-0.0.1-py3-none-any.whl
| Algorithm | Hash digest | |
|---|---|---|
| SHA256 | c96b69073b1807f2830d0b6e1f32fab1e8dc2ab8ef93ca93d37ef7afe444d8ac |
|
| MD5 | 09f795a861c7aaa454ed451489308e5b |
|
| BLAKE2b-256 | 5086063025ed1128f873bbfec30b42eb750c479cef5ead2b73d265a65edf1f05 |


