Data analysis of peak and valley regions

Project description
Peakoscope


Peakoscope is a python package for hierarchical analysis of peak and valley regions in numeric data.
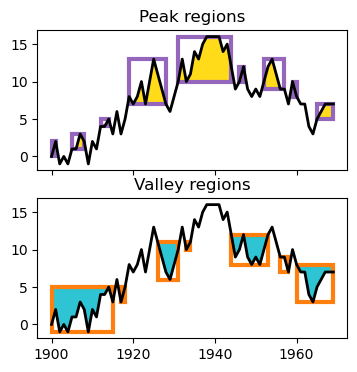
- Peak and valley regions can be nested, for example, when a large peak region contains smaller subpeak regions.
- Based on a one-pass algorithm that finds all peak regions and orders them into a tree.
- Classes for peak/valley objects and tree objects.
- Optional interfaces to matplotlib, pandas and polars.
Usage examples
Compute the tree of nested peak regions in a data set:
>>> import peakoscope
>>> data = [10, 30, 40, 30, 10, 50, 70, 70, 50, 80]
>>> print(peakoscope.tree(data))
0:10
├─5:10
│ ├─9:10
│ └─6:8
└─1:4
  └─2:3
From the tree, select default peak regions and print their subarrays of data:
>>> for peak in peakoscope.tree(data).size_filter():
...    print(peak.subarray(data))
...
[80]
[70, 70]
[30, 40, 30]
Howto files
The github repo contains tutorials and a glossary:
Authors
- Eivind Tøstesen, contact@tostesen.no
License
Copyright (C) 2021-2024 Eivind Tøstesen. This software is licensed under GPLv3
Citation
Citation can include one or more of:
-
Peakoscope + version
-
Github URL: https://github.com/eivindtostesen/hierarchical_peak_finding
-
PyPI URL: https://pypi.org/project/peakoscope/
-
The open-access article:
Tøstesen, E. A stitch in time: Efficient computation of genomic DNA melting bubbles. Algorithms for Molecular Biology, 3, 10 (2008). DOI: 10.1186/1748-7188-3-10
Release history Release notifications | RSS feed


Download files
Download the file for your platform. If you're not sure which to choose, learn more about installing packages.
Source Distribution
Built Distribution
Hashes for peakoscope-1.0.0-py3-none-any.whl
| Algorithm | Hash digest | |
|---|---|---|
| SHA256 | acf8061970090e556bd8bef19d22eb71a1bf1809e8a2042c6449e0c7c252c8f2 |
|
| MD5 | a5b784a9242d62a35bf1ef8037761992 |
|
| BLAKE2b-256 | e83f249b234f0eda39e2bc2c6f8b0e1d7e13b0726be45235a45bcfc9e92af597 |


