No project description provided

Project description
PREVIS
(Python Request Engine for Virtual Interferometric Survey)


PREVIS is a Python module that provides functions to help determine the observability of astronomical sources
in a few lines of code.
One can perform a single object search (previs.search) or a multiple-objects search (previs.survey).
These functions use data from the Virtual Observatory (OV), such as:
- Spectral Energy Distribution (SED) from Vizier.
- Magnitudes: visible (V, R, G), near-infrared (J, H, K) and mid-infrared (L, M, N). The SED is used to extract the missing magnitudes of Simbad. Especially L (3.5 µm), M (4.5 µm), and N (10 µm) magnitudes which are not often included in the standard catalogs,
- Spectral type,
- Celestial coordinates,
- Gaia DR2 informations (if available).
PREVIS compares the magnitudes to the current limiting magnitudes of each instruments to determine whether the target is observable with current performances. The actual instruments are installed at:
- The european Very Large Telescope Interferometer (VLTI) with PIONIER (H band), GRAVITY (K band) and MATISSE (L, M, N bands),
- The american Center for Hight Angular Resolution Astronomy (CHARA), with VEGA (V band), PAVO (R bands), MIRC (H band), CLIMB (K band) and CLASSIC (H, K bands).
PREVIS also uses the V or G magnitudes to check the guiding issues or the tip/tilt correction limit. For the VLTI: if the star is too faint in G mag, PREVIS will look for the list of stars around the target (57 arcsec) with the appropriate magnitude and give the list of celestial coordinates usable as guiding star. Of course, PREVIS checks also the on-site observability given the latitude of both observatories.
Install from source (for conda-based systems)
It is recommended (though not mandatory) to create a separate environment with conda create -n <env_name>.
Then, within your Conda env (conda activate <env_name>):
pip install previs-astro
What can PREVIS do for you?
PREVIS is developed and thought to be used in interactive session, so we recommend to use it into an ipython session. A detailed descriptions of previs functions and outputs can be found in the api_reference.md document.
An example script example.py is included to test the possibilities offered by PREVIS. The example includes a single target
research using previs.search, a visualisation solution for the VLTI (previs.plot_VLTI) and CHARA (previs.plot_CHARA).
The example also presents the survey capabilities of the module.
⚡ Last updates (02/2023) : PREVIS is now usable in command line.
# Check the observability of Betelgeuse from the VLTI and CHARA
previs search -t Betelgeuse -p
# Same for several targets
previs survey -t Betelgeuse vega -p
Note: you can check input parameters with
previs search -h
PREVIS can be used in command line (since v1.0) or through scripts. If you want to simply use the example.py, you can run it in interactive session.
ipython --matplotlib -i example.py
For instance, if you use previs.search to fetch data about the star CI Tau, you can display the resulting observability with the VLTI instruments with previs.plot_VLTI:
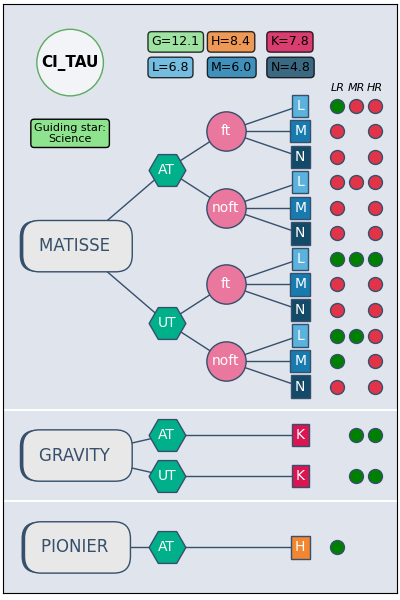
Such a graph represents multiple informations:
- Upper left: the name of the target with a green cirle if the star is observable from the VLTI, red if not,
- Upper right: appropriate magnitudes for the VLTI instruments,
- The round square at the bottom of the target indicate the information of the guiding star:
- 'Science': the target is bright enought to be used as guiding star,
- 'off axis': the coudé off-axis guiding need to be used,
- 'off axis*', the coudé off-axis guiding can only be performed in visitor mode.
- The organigram of each instrument:
- The blue/green octogone indicate the telescope (UT (8m) or AT (1.8m)),
- The pink circle indicate if fringe tracker (GRA4MAT) is used (ft) or not (noft),
- The colored squares indicates the observing bands (same color as magnitudes),
- The right circles are green if the target is observable for each spectral resolution (low (LR), medium (MR) or high (HR)), red if not.
Now, if you use previs.survey on a large list of stars, e.g: the 666 Wolf-Rayet stars of the galaxy. previs.count indicates that 284 stars are observable from the VLTI (42.6%) and 64 from CHARA (9.6%). You can display the histogram of the result using previs.plot_histo_survey:
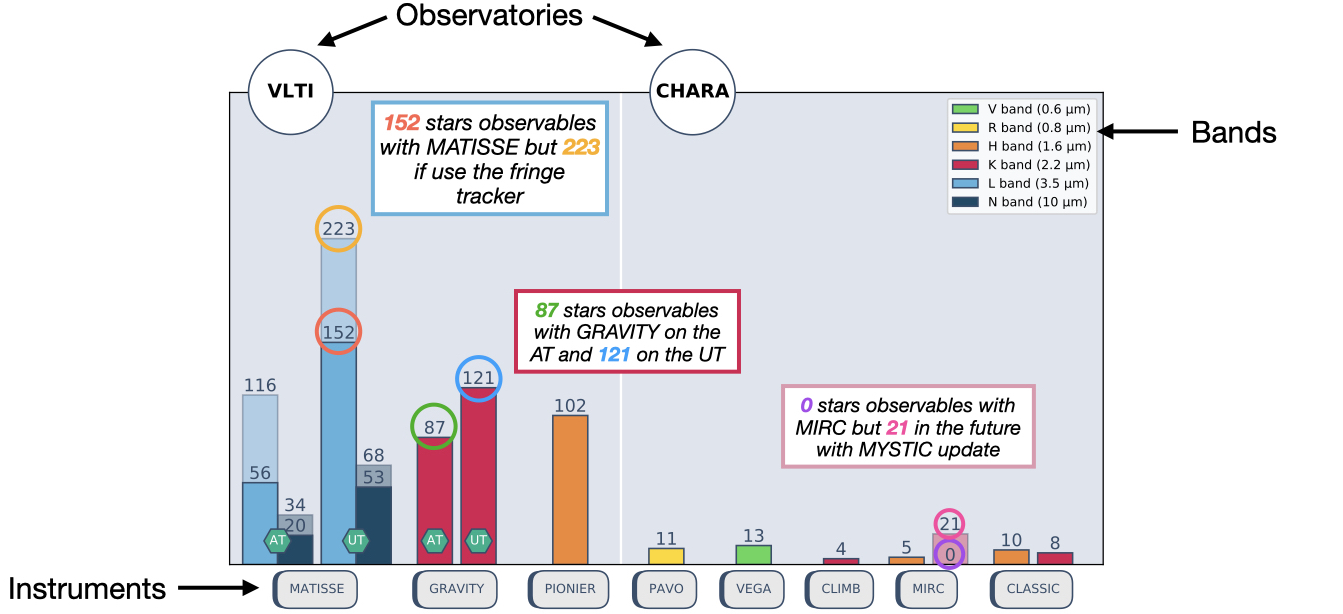
In this case, you can see that those stars are not observable with all instruments and depend of the considered mode. For instance, 20 stars are observables with MATISSE in low spectral resolution with the AT in N band (dark blue bar).
The background bars for MATISSE and MIRC indicate respectively, the fringe tracker possibility (GRA4MAT) and the future update MYSTIC operating in K-band. In this case, 152 stars are observable with MATISSE in L-band with the UT but 223 if you use the fringe tracker (see ft/noft of previs.search result and desc_survey_large.jpeg).
A smaller survey is presented in example.py, where you can plot the high spectral resolution results (see. desc_survey_example.jpeg).
Acknowledgements
PREVIS was developed to help the interferometry user community. I decided to share this simple but useful (hopefully) tool to optimise your time and prepare your futur observing proposals with the VLTI and CHARA. Do not hesitate to raise some undetected problems so far despite our efforts (thanks C. Robert and others). ENJOY!
Release history Release notifications | RSS feed


Download files
Download the file for your platform. If you're not sure which to choose, learn more about installing packages.
Source Distribution
Built Distribution
Hashes for previs_astro-1.0.1-py3-none-any.whl
| Algorithm | Hash digest | |
|---|---|---|
| SHA256 | 13c6b7776e8ea2639917d070b8e7ad9cfd32ba73f9ecbd38a1ee4f6572148f6d |
|
| MD5 | 5768974fe5241855fbfcfb1efd4fc7d5 |
|
| BLAKE2b-256 | 4aa70a0f8162db80d91197c537d2e194b2a37c4b53498968ab1581ee5a0bfa34 |


