pprofile + matplotlib = Python program profiled as an awesome heatmap!

Project description

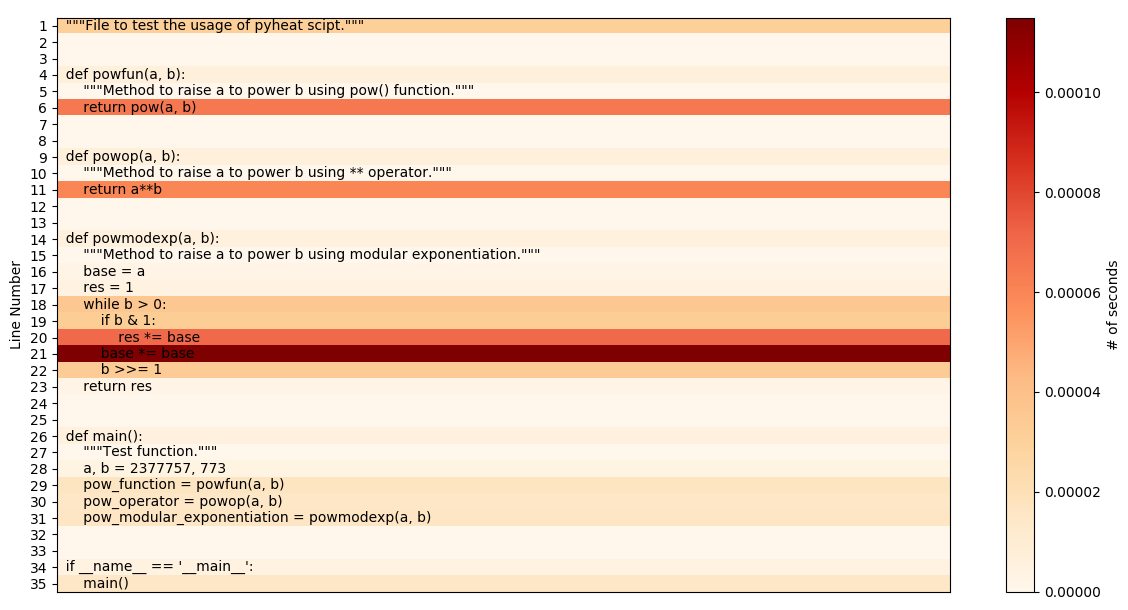
Profilers are extremely helpful tools. They help us dig deep into code, find and understand performance bottlenecks. But sometimes we just want to lay back, relax and still get a gist of the hot zones in our code.
A picture is worth a thousand words.
So, instead of presenting the data in tabular form, if presented as a heatmap visualization, it makes comprehending the time distribution in the given program much easier and quicker. That is exactly what is being done here !
Features
- star:
Simple CLI interface.
- star:
No complicated setup.
- star:
Heatmap visualization to view hot zones in code.
Setup
With pip installed on your system, execute
Using pip
pip install py-heatDirectly from the repository
git clone https://github.com/csurfer/pyheat.git
python pyheat/setup.py install
Usage
To view heatmap of a python file use:
pyheat --pyfile <path_to_python_file>To view help use:
pyheat --helpContributing
Bug Reports and Feature Requests
Please use issue tracker for reporting bugs or feature requests.
Development
Pull requests are most welcome.


Download files
Download the file for your platform. If you're not sure which to choose, learn more about installing packages.


