A collection of algorithms for fitting the baseline of experimental data.

Project description


pybaselines is a collection of baseline algorithms for fitting experimental data.
For Python 3.6+
Open Source: BSD 3-Clause License
Source Code: https://github.com/derb12/pybaselines
Documentation: https://pybaselines.readthedocs.io.
Introduction
pybaselines provides many different algorithms for fitting baselines to data from experimental techniques such as Raman, FTIR, NMR, XRD, PIXE, etc. The aim of the project is to provide a semi-unified API to allow quickly testing and comparing multiple baseline algorithms to find the best one for a set of data.
pybaselines has 25+ baseline algorithms. Baseline fitting techniques are grouped accordingly (note: when a method is labelled as ‘improved’, that is the method’s name, not editorialization):
Polynomial (pybaselines.polynomial)
poly (Regular Polynomial)
modpoly (Modified Polynomial)
imodpoly (Improved Modified Polynomial)
penalized_poly (Penalized Polynomial)
loess (Locally Estimated Scatterplot Smoothing)
Whittaker-smoothing-based techniques (pybaselines.whittaker)
asls (Asymmetric Least Squares)
iasls (Improved Asymmetric Least Squares)
airpls (Adaptive Iteratively Reweighted Penalized Least Squares)
arpls (Asymmetrically Reweighted Penalized Least Squares)
drpls (Doubly Reweighted Penalized Least Squares)
iarpls (Improved Asymmetrically Reweighted Penalized Least Squares)
aspls (Adaptive Smoothness Penalized Least Squares)
psalsa (Peaked Signal’s Asymmetric Least Squares Algorithm)
Morphological (pybaselines.morphological)
mpls (Morphological Penalized Least Squares)
mor (Morphological)
imor (Improved Morphological)
mormol (Morphological and Mollified Baseline)
amormol (Averaging Morphological and Mollified Baseline)
rolling_ball (Rolling Ball Baseline)
Window-based (pybaselines.window)
noise_median (Noise Median method)
snip (Statistics-sensitive Non-linear Iterative Peak-clipping)
swima (Small-Window Moving Average)
Optimizers (pybaselines.optimizers)
collab_pls (Collaborative Penalized Least Squares)
optimize_extended_range
adaptive_minmax (Adaptive MinMax)
Manual methods (pybaselines.manual)
linear_interp (Linear interpolation between points)
Installation
Dependencies
pybaselines requires Python version 3.6 or later and the following libraries:
All of the required libraries should be automatically installed when installing pybaselines using either of the two installation methods below.
Stable Release
pybaselines is easily installed using pip, simply by running the following command in your terminal:
pip install --upgrade pybaselinesThis is the preferred method to install pybaselines, as it will always install the most recent stable release.
Development Version
The sources for pybaselines can be downloaded from the Github repo.
The public repository can be cloned using:
git clone https://github.com/derb12/pybaselines.gitOnce the repository is downloaded, it can be installed with:
cd pybaselines
python setup.py install
Quick Start
To use the various functions in pybaselines, simply input the measured data and any required parameters. All baseline functions in pybaselines will output two items: a numpy array of the calculated baseline and a dictionary of parameters that can be helpful for reusing the functions.
For more details on each baseline algorithm, refer to the algorithms section of pybaselines’s documentation.
A simple example is shown below.
import pybaselines
import matplotlib.pyplot as plt
import numpy as np
x = np.linspace(100, 4200, 1000)
# a measured signal containing several Gaussian peaks
signal = (
pybaselines.utils.gaussian(x, 2, 700, 50)
+ pybaselines.utils.gaussian(x, 3, 1200, 150)
+ pybaselines.utils.gaussian(x, 5, 1600, 100)
+ pybaselines.utils.gaussian(x, 4, 2500, 50)
+ pybaselines.utils.gaussian(x, 7, 3300, 100)
)
# baseline is a polynomial plus a broad gaussian
true_baseline = (
10 + 0.001 * x
+ pybaselines.utils.gaussian(x, 6, 2000, 2000)
)
noise = np.random.default_rng(1).normal(0, 0.2, x.size)
y = signal + true_baseline + noise
bkg_1 = pybaselines.polynomial.modpoly(y, x, poly_order=3)[0]
bkg_2 = pybaselines.whittaker.asls(y, lam=1e7, p=0.01)[0]
bkg_3 = pybaselines.morphological.imor(y, half_window=25)[0]
bkg_4 = pybaselines.window.snip(
y, max_half_window=40, decreasing=True, smooth_half_window=1
)[0]
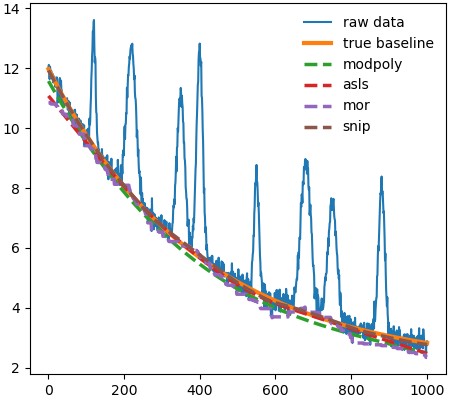
plt.plot(x, y, label='raw data', lw=1.5)
plt.plot(x, true_baseline, lw=3, label='true baseline')
plt.plot(x, bkg_1, '--', label='modpoly')
plt.plot(x, bkg_2, '--', label='asls')
plt.plot(x, bkg_3, '--', label='imor')
plt.plot(x, bkg_4, '--', label='snip')
plt.legend()
plt.show()The above code will produce the image shown below.
Contributing
Contributions are welcomed and greatly appreciated. For information on submitting bug reports, pull requests, or general feedback, please refer to the contributing guide.
Changelog
Refer to the changelog for information on pybaselines’s changes.
License
pybaselines is open source and freely available under the BSD 3-clause license. For more information, refer to the license.
Release history Release notifications | RSS feed


Download files
Download the file for your platform. If you're not sure which to choose, learn more about installing packages.
Source Distribution
Built Distribution
Hashes for pybaselines-0.3.0-py3-none-any.whl
| Algorithm | Hash digest | |
|---|---|---|
| SHA256 | 572af062443f5ec4efe81b37e13da1038a12c9e3debfae2e83af6fb7ff056a4c |
|
| MD5 | 83599ab85105c1f2d632b9752dad9908 |
|
| BLAKE2b-256 | dfe94247bd6dc5611e73ece585aebe377607289fbdd8f0848aba61aaf999c9bd |


