Package to analyse stochastic time series data

Project description
PyDaddy
Python Data Driven Dynamics
A python package to discover SDE equation from time-series data.


PyDaddy is a comprehensive and easy to use python package to obtain data-derived stochastic differential equations from time series data. PyDaddy provides a workflow that takes time series of state variable (x) as input and gives an SDE of the form:

where η(t) is uncorrelated white noise. The function f is called the drift, and governs the deterministic part of the dynamics. g2 is called the diffusion and governs the stochastic part of the dynamics.
PyDaddy is packed with tailored visualization and analysis functionalities that help the user to interpret their data.

Installation
PyDaddy is available both on PyPi and anaconda cloud and requires an environment with python>=3.7
Using pip
pip install pydaddy
or
pip install git+https://github.com/tee-lab/PyDaddy.git
Manual installation
Alternatively, the package can also be installed by cloning/downloading the git repository and running setup.py file.
git clone https://github.com/tee-lab/PyDaddy.git
cd PyDaddy
python setup.py install
How it works
Suppose we have a time-series data of an observation, and we wish to discover a stochastic differential equation describing the dynamics of the system of the form:

PyDaddy works in a two step process:
- The drift and diffusion components, corresponding to f and g2 are extracted from the time-series data using conditional moments.


- The estimated drift and diffusion are used to fit functional forms for f and g2 using sparse-regression.
By combining the traditional techniques for reconstructing the drift and diffusion components with the novel equation learning techniques, PyDaddy reliably reconstructs governing equations for wide range of dynamics.
PyDaddy extends this approach to vector time-series data as well!
Features
- Simple one line execution of analysis.
- Able to distinguish between system with similar steady state behavior.
- Produces intuitive visuals of data and obtained result.
- Supports time series data with both scalar and vector order parameters.
- Diagnostics help understand change in order of drift and diffusion with varying timescale.
- Generates interactive, drift and diffusion sliders for user defined timescale range or list.
Usage
Initializing a pydaddy object
To start analysis, we need to create a pydaddy object with our dataset. This will compute the drift and diffusion parts, and generate a summary plot. To initialize a pydaddy object, we need to provide the following arguments:
data: the timeseries data, could be either one or two dimensional. This example will deal with 1D data.pydaddyassumes that the samples are evenly spaced.datashould be a list of Numpy arrays; with one array for the scalar case, and two arrays for the vector case.t: This could either be scalar, denoting the time-interval between samples, or an array denoting the timestamp of each sample.
Following are some useful optional arguments (see documentation for detailed descriptions of every optional argument).
This example uses a sample data-set, loaded using a helper function. For details about data formats and loading/saving data.
import pydaddy
data, t = pydaddy.load_sample_dataset('model-data-scalar-pairwise')
ddsde = pydaddy.Characterize(data, t, bins=20)
| M range              :   (-1.0, 1.0)  |
| M mean               :      0.014     |
| |M| range            :   (0.0, 1.0)   |
| |M| mean             :      0.631     |
| Autocorr time (M)    :       53       |
| (Dt, dt)             :     (1, 1)     |

pydaddy.Characterize initializes a ddsde object which can be used for further analysis. It also produces summary plots, showing the time-series, histograms, and the estimated drift and diffusion functions.
pydaddy can automatically try to fit polynomial functions if called with argument fit_functions=True. However, for best results, it is recommended to do the fitting separately, with some level of manual intervention.
Recovering functional forms for f and g
pydaddy has a fit() function which can recover functional forms for the drift and diffusion functions, using sparse regression. By default, pydaddy fits polynomials (of a specified degree), but it is possible to fit arbitrary functions by specifying a custom library.
Two parameters need to be specified during fitting:
order: The maximum degree of the polynomial to be fittedthreshold: a sparsification threshold, that governs the level of sparsity (i.e. the number of terms in the polynomial). Forthreshold=theta, the fitted polynomial will only have terms with coefficients greater thantheta.
We can ask pydaddy to try to automatically find an appropriate sparsification threshold by calling fit() with argument tune=True.
# Fitting with automatic threshold tuning
F = ddsde.fit('F', order=3, tune=True)
print(F)
(-0.021 ± 0.002)x
G = ddsde.fit('G', order=3, tune=True)
print(G)
(0.039 ± 0.000) + (-0.039 ± 0.000)x^2
In the above example, automatic model selection (tune=True) sucessfully found the correct threshold. If the data is too noisy, or if order is over-estimated, automatic model selection can give poor results. In such cases, good results can be obtained with some manual intervention.
Once the functions are fitted, the pydaddy summary plot will show the fitted curves for drift and diffusion, alongside the points.
ddsde.summary()
| M range              :   (-1.0, 1.0)  |
| M mean               :      0.014     |
| |M| range            :   (0.0, 1.0)   |
| |M| mean             :      0.631     |
| Autocorr time (M)    :       53       |
| (Dt, dt)             :     (1, 1)     |

Drift:
(-0.021 ± 0.002)x

Diffusion:
(0.039 ± 0.000) + (-0.039 ± 0.000)x^2

The fitted functions can also be printed individually.
print(ddsde.F)
(-0.021 ± 0.002)x
print(ddsde.G)
(0.039 ± 0.000) + (-0.039 ± 0.000)x^2
dddsde.F and ddsde.G are, in fact, callable functions: this means that you can call ddsde.F or ddsde.G with some desired arguments and evaluate the drift or diffusion for that value.
ddsde.F(0.2)
-0.004170417170682441
Interactive plots for drift and diffusion
To get interactive plots for the drift and diffusion functions, use ddsde.drift() or ddsde.diffusion(). These will be particularly useful for the 2-D case, where the drift and diffusion plots will be 3-D plots.
ddsde.drift()

ddsde.diffusion()

Diagnostics
For a drift-diffusion model fit to be valid, the data should satisfy some underlying assumptions. pydaddy.noise_diagnostics() allows us to verify if the data satisfies these assumptions.
The function produces 4 plots:
- The distribution of the residuals, which should be a Gaussian.
- QQ plot of the residual distribution, against a theoretical Gaussian distribution of the same mean and variance. Ideally (i.e. if the residuals are Gaussian distributed), all points of this plot should fall on a straight line of slope 1.
- Autocorrelation plot of the residuals. Ideally, the residuals should be uncorrelated, i.e. autocorrelation time should be close to 0.
- The plot of the 2nd and 4th Kramer-Moyal coefficients. Theory dictates that $\text{KM}(4)$ should equal 3 times $\text{KM}(2)$, i.e. the plot should be a straight line of slope 1.
ddsde.noise_diagnostics()
Noise statistics:
	Mean: 0.0056 		Std. Dev.: 0.1999
	Skewness: -0.0552	Kurtosis: 0.0137

Noise autocorrelation time: 0.185 time-step

The fit_diagnostics() function returns the quality of fits for the fitted drift and diffusion functions. This function prints:
- The fitted polynomials, with standard errors of coefficients.
- R2 value of the fit.
- R2 value of the fit, excluding outliers (points in the bottom 0.1 and top 99.9 percentiles are treated as outliers).
ddsde.fit_diagnostics()
Drift:
 F = (-0.021 ± 0.002)x
    Adjusted R-squared : 0.7908
    Adjusted R-squared (without outliers) : 0.8681

Diffusion:
 G = (0.039 ± 0.000) + (-0.039 ± 0.000)x^2
    Adjusted R-squared : 0.9539
    Adjusted R-squared (without outliers) : 0.9420
Motivation
Data set description
PyDaddy has six data set included along with the package which can be loaded using load_sample_dataset(dataset_name) function
Experiment data (from experimentation or from observations)
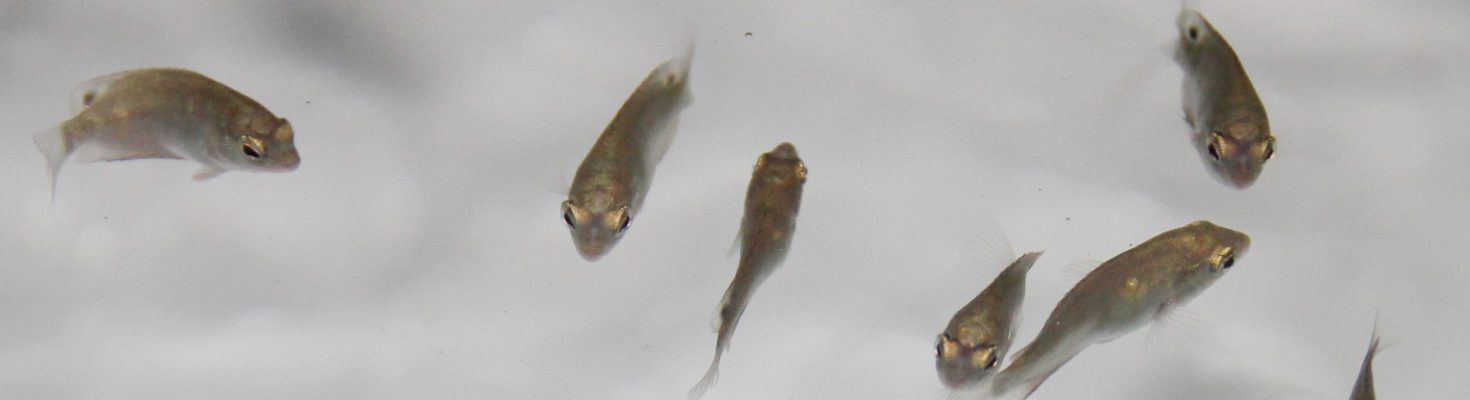
fish-data-ectropus:
A data from experiment conducted with a group of 30 fish, in which the group polarity in x and y directions are recorded every 0.12 seconds.
This data is a part of the work done in the Noise-Induced Schooling of Fish
Simulation data
A synthetic data set obtained from the simulation of fish interactions.
model-data-vector-pairwise :
Pairwise interaction of fish simulated in two dimension.
model-data-vector-ternary:
Ternary interaction of fish simulated in two dimension.
model-data-scalar-pairwise:
Pairwise interaction of fish simulated in single dimension.
model-data-scalar-ternary:
Ternary interaction of fish simulated in single dimension.
The simulation method is inspired from the work done in Noise-induced Effects in Collective Dynamics and Inferring Local Interactions from Data
Licence
Distributed under GNU General Public License v3.0. See Licence.txt for more information.
Reference
[1] Noise-induced Effects in Collective Dynamics and Inferring Local Interactions from Data Preprint Github
Release history Release notifications | RSS feed


Download files
Download the file for your platform. If you're not sure which to choose, learn more about installing packages.


