Access the climate data from the Daymet database through its RESTful service.

Project description


Package |
Description |
Status |
|---|---|---|
Navigate and subset NHDPlus (MR and HR) using web services |
||
Access topographic data through National Map’s 3DEP web service |
||
Access NWIS, NID, HCDN 2009, NLCD, and SSEBop databases |
||
Access Daymet for daily climate data both single pixel and gridded |
||
High-level API for asynchronous requests with persistent caching |
||
Send queries to any ArcGIS RESTful-, WMS-, and WFS-based services |
||
Convert responses from PyGeoOGC’s supported web services to datasets |


PyDaymet: Daily climate data through Daymet


Features
PyDaymet is a part of HyRiver software stack that is designed to aid in watershed analysis through web services. This package provides access to climate data from Daymet V4 database using NetCDF Subset Service (NCSS). Both single pixel (using get_bycoords function) and gridded data (using get_bygeom) are supported which are returned as pandas.DataFrame and xarray.Dataset, respectively. Climate data is available for North America, Hawaii from 1980, and Puerto Rico from 1950 at three time scales: daily, monthly, and annual. Additionally, PyDaymet can compute Potential EvapoTranspiration (PET) using FAO Penman-Monteith equation for both single pixel and gridded data.
To fully utilize the capabilities of the NCSS, under-the-hood, PyDaymet uses AsyncRetriever for retrieving Daymet data asynchronously with persistent caching. This improves the reliability and speed of data retrieval significantly.
You can try using PyDaymet without installing it on you system by clicking on the binder badge below the PyDaymet banner. A Jupyter notebook instance with the stack pre-installed will be launched in your web browser and you can start coding!
Please note that since this project is in early development stages, while the provided functionalities should be stable, changes in APIs are possible in new releases. But we appreciate it if you give this project a try and provide feedback. Contributions are most welcome.
Moreover, requests for additional functionalities can be submitted via issue tracker.
Installation
You can install PyDaymet using pip after installing libgdal on your system (for example, in Ubuntu run sudo apt install libgdal-dev):
$ pip install pydaymetAlternatively, PyDaymet can be installed from the conda-forge repository using Conda:
$ conda install -c conda-forge pydaymetQuick start
You can use PyDaymet using command-line or as a Python library. The commanda-line provides access to two functionality:
Getting gridded climate data: You must create a geopandas.GeoDataFrame that contains the geometries of the target locations. This dataframe must have at least five columns: id, start, end, region, and geometry. The id column is used as filenames for saving the obtained climate data to a NetCDF (.nc) file. The start and end columns are starting and ending dates of the target period. The region columns determines the geometry’s region of each row (na, hi, or pr). Then, you must save the dataframe to a file with extensions such as .shp or .gpkg (whatever that geopandas.read_file can read).
Getting single pixel climate data: You must create a pandas.DataFrame that contains coordinates of the target locations. This dataframe must have at least five columns: id, start, end, region, x, and y. The id column is used as filenames for saving the obtained climate data to a CSV (.csv) file. The start, end, and region columns the same as the before. The x and y columns are coordinates of the target locations.
pydaymet has three required arguments and four optional:
pydaymet --help
Usage: pydaymet [OPTIONS] TARGET TARGET_TYPE CRS

  Retrieve cliamte data within geometries or elevations for a list of coordinates.

  TARGET: Path to a geospatial file (any file that geopandas.read_file can open) or a csv file.

  The input files should have three columns:

      - id: Feature identifiers that daymet uses as the output netcdf/csv filenames.
      - start: Starting time.
      - end: Ending time.
      - region: Target region (na for CONUS, hi for Hawaii, and pr for Puerto Rico.

  If target_type is geometry, an additional geometry column is required.
  If it is coords, two additional columns are need: x and y.

  TARGET_TYPE: Type of input file: "coords" for csv and "geometry" for geospatial.

  CRS: CRS of the input data.

  Examples:

      $ pydaymet ny_coords.csv coords epsg:4326 -v prcp -v tmin -p -t monthly
      $ pydaymet ny_geom.gpkg geometry epsg:3857 -v prcp

Options:
  -v, --variables TEXT            Target variables. You can pass this flag
                                  multiple times for multiple variables.
  -t, --time_scale [daily|monthly|annual]
                                  Target time scale.
  -p, --pet                       Compute PET.
  -s, --save_dir PATH             Path to a directory to save the requested files. Extension
                                  for the outputs is .nc for geometry and .csv for coords.
  -h, --help                      Show this message and exit.
Now, let’s see how we can use PyDaymet as a library.
PyDaymet offers two functions for getting climate data; get_bycoords and get_bygeom. The arguments of these functions are identical except the first argument where the latter should be polygon and the former should be a coordinate (a tuple of length two as in (x, y)). The input geometry or coordinate can be in any valid CRS (defaults to EPSG:4326). The dates argument can be either a tuple of length two like (start_str, end_str) or a list of years like [2000, 2005]. It is noted that both functions have a pet flag for computing PET. Additionally, we can pass time_scale to get daily, monthly or annual summaries. This flag by default is set to daily.
from pynhd import NLDI
import pydaymet as daymet

geometry = NLDI().get_basins("01031500").geometry[0]

var = ["prcp", "tmin"]
dates = ("2000-01-01", "2000-06-30")

daily = daymet.get_bygeom(geometry, dates, variables=var, pet=True)
monthly = daymet.get_bygeom(geometry, dates, variables=var, time_scale="monthly")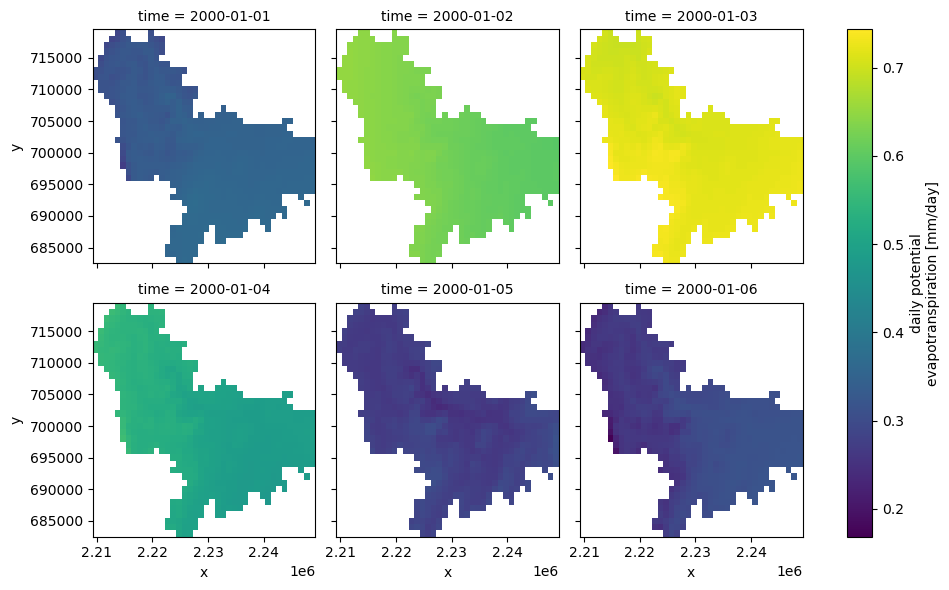
If the input geometry (or coordinate) is in a CRS other than EPSG:4326, we should pass it to the functions.
coords = (-1431147.7928, 318483.4618)
crs = "epsg:3542"
dates = ("2000-01-01", "2006-12-31")
annual = daymet.get_bycoords(coords, dates, variables=var, loc_crs=crs, time_scale="annual")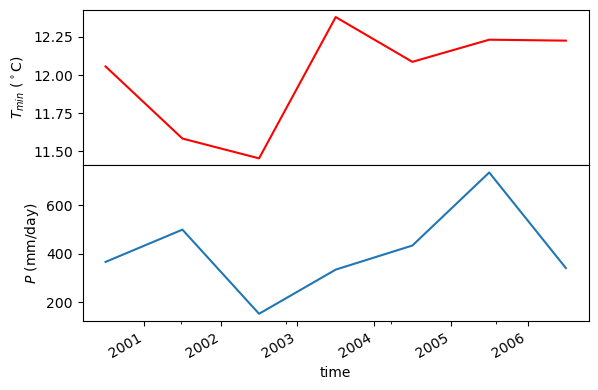
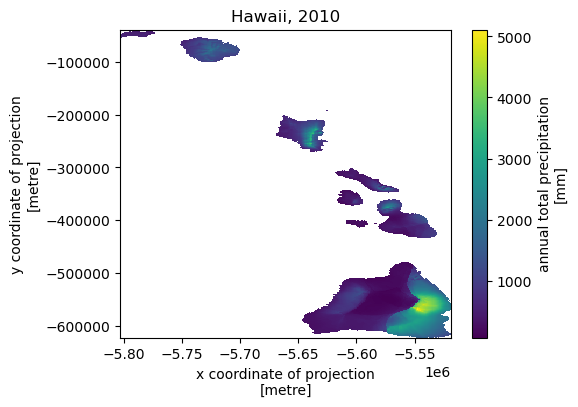
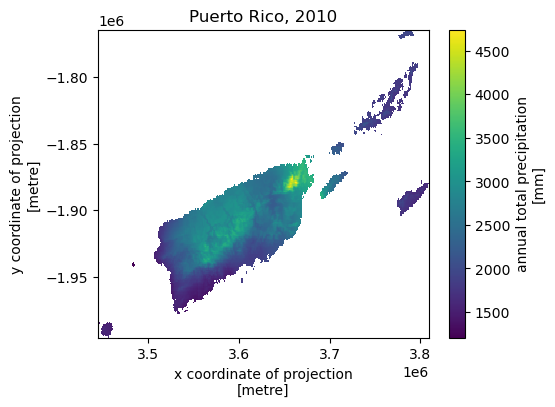
Next, let’s get annual total precipitation for Hawaii and Puerto Rico for 2010.
hi_ext = (-160.3055, 17.9539, -154.7715, 23.5186)
pr_ext = (-67.9927, 16.8443, -64.1195, 19.9381)
hi = daymet.get_bygeom(hi_ext, 2010, variables="prcp", region="hi", time_scale="annual")
pr = daymet.get_bygeom(pr_ext, 2010, variables="prcp", region="pr", time_scale="annual")
Some example plots are shown below:
Contributing
Contributions are very welcomed. Please read CONTRIBUTING.rst file for instructions.
Credits
Credits to Koen Hufkens for his implementation of accessing the Daymet RESTful service, daymetpy.
Release history Release notifications | RSS feed


Download files
Download the file for your platform. If you're not sure which to choose, learn more about installing packages.
Source Distribution
Built Distribution
Hashes for pydaymet-0.11.1-py3-none-any.whl
| Algorithm | Hash digest | |
|---|---|---|
| SHA256 | f13b2673a73abe092bb730c24d22d53f48ce73b0a3ccaa4a802ad1fc292d2d03 |
|
| MD5 | a0cda25cf94030f5c49d722ca9d9aea4 |
|
| BLAKE2b-256 | f86b7647d8fdd87ea3b826935709f927cd8eaea49d56583c2f488e51306624dc |


