Call stack profiler for Python. Shows you why your code is slow!

Project description
pyinstrument


Pyinstrument is a Python profiler. A profiler is a tool to help you 'optimize' your code - make it faster. It sounds obvious, but to get the biggest speed increase you must focus on the slowest part of your program. Pyinstrument helps you find it!

Documentation
Installation
pip install pyinstrument
Pyinstrument supports Python 2.7 and 3.3+.
How to use it
Pyinstrument tells you which sections of code are making your software slow. It does this by observing your program's execution and then presenting a report that highlights the slow parts.
Profile a Python script
Call Pyinstrument directly from the command line. Instead of writing
python script.py, type pyinstrument script.py. Your script will run as
normal, and at the end (or when you press ^C), Pyinstrument will output a
colored summary showing where most of the time was spent.
Here are the options you can use:
Usage: pyinstrument [options] scriptfile [arg] ...

Options:
  -h, --help            show this help message and exit
  -m MODULE_NAME        run library module as a script, like 'python -m
                        module'
  -r RENDERER, --renderer=RENDERER
                        how the report should be rendered. One of: 'text',
                        'html', 'json', or python import path to a renderer
                        class
  --html                Shortcut for '--renderer=html'
  -o OUTFILE, --outfile=OUTFILE
                        save report to <outfile>
  --unicode             (text renderer only) force unicode text output
  --no-unicode          (text renderer only) force ascii text output
  --color               (text renderer only) force ansi color text output
  --no-color            (text renderer only) force no color text output
Profile a specific chunk of code
Pyinstrument also has a Python API. Just surround your code with Pyinstrument, like this:
from pyinstrument import Profiler

profiler = Profiler()
profiler.start()

# code you want to profile

profiler.stop()

print(profiler.output_text(unicode=True, color=True))
(You can omit the unicode and color flags if your output/terminal does
not support them.)
Profile a web request in Django
Pyinstrument can also profile web requests in Django. To use it, add
pyinstrument.middleware.ProfilerMiddleware to MIDDLEWARE_CLASSES in your
settings.py.
Once installed, add ?profile to the end of a request URL to activate the
profiler. Your request will run as normal, but instead of getting the response,
you'll get pyinstrument's analysis of the request in a web page.
If you're writing an API, it's not easy to change the URL when you want to
profile something. In this case, add PYINSTRUMENT_PROFILE_DIR = 'profiles'
to your settings.py. Pyinstrument will profile every request and save the
HTML output to the folder profiles in your working directory.
Profile a web request in Flask
A simple setup to profile a Flask application is the following:
from flask import Flask, g, make_response, request
app = Flask(__name__)

@app.before_request
def before_request():
    if "profile" in request.args:
        g.profiler = Profiler()
        g.profiler.start()


@app.after_request
def after_request(response):
    if not hasattr(g, "profiler"):
        return response
    g.profiler.stop()
    output_html = g.profiler.output_html()
    return make_response(output_html)
This will check for the ?profile query param on each request and if found, it starts profiling. After each request where the profiler was running it creates the html output and returns that instead of the actual response.
Profile something else?
I'd love to have more ways to profile using Pyinstrument - e.g. other web frameworks. PRs are encouraged!
How is it different to profile or cProfile?
Statistical profiling (not tracing)
Pyinstrument is a statistical profiler. That means it does not track every single function call that your program makes. Instead, it's 'sampling' the process every 1ms and recording the call stack at that point.
That gives some clear advantages over other profilers. Statistical profilers are much lower-overhead (and thus accurate) than tracing profilers.
| Django template render × 4000 | Overhead | |
|---|---|---|
| Base | ████████████████ 0.33s |
|
| pyinstrument | ████████████████████ 0.43s |
30% |
| cProfile | █████████████████████████████ 0.61s |
84% |
| profile | ██████████████████████████████████...██ 6.79s |
2057% |
This overhead is important a lot can distort your timings. When using a tracing profiler, code that makes a lot of Python function calls could appear to take longer than code that does not.
Full-stack recording
The standard Python profilers profile and cProfile produce
output where time is totalled according to the time spent in each function.
This is great, but it falls down when you profile code where most time is
spent in framework code that you're not familiar with.
Here's an example of profile output when using Django.
151940 function calls (147672 primitive calls) in 1.696 seconds

   Ordered by: cumulative time

   ncalls  tottime  percall  cumtime  percall filename:lineno(function)
        1    0.000    0.000    1.696    1.696 profile:0(<code object <module> at 0x1053d6a30, file "./manage.py", line 2>)
        1    0.001    0.001    1.693    1.693 manage.py:2(<module>)
        1    0.000    0.000    1.586    1.586 __init__.py:394(execute_from_command_line)
        1    0.000    0.000    1.586    1.586 __init__.py:350(execute)
        1    0.000    0.000    1.142    1.142 __init__.py:254(fetch_command)
       43    0.013    0.000    1.124    0.026 __init__.py:1(<module>)
      388    0.008    0.000    1.062    0.003 re.py:226(_compile)
      158    0.005    0.000    1.048    0.007 sre_compile.py:496(compile)
        1    0.001    0.001    1.042    1.042 __init__.py:78(get_commands)
      153    0.001    0.000    1.036    0.007 re.py:188(compile)
  106/102    0.001    0.000    1.030    0.010 __init__.py:52(__getattr__)
        1    0.000    0.000    1.029    1.029 __init__.py:31(_setup)
        1    0.000    0.000    1.021    1.021 __init__.py:57(_configure_logging)
        2    0.002    0.001    1.011    0.505 log.py:1(<module>)
It's often hard to understand how your own code relates to these traces.
Pyinstrument records the entire stack, so tracking expensive calls is much easier.
'Wall-clock' time (not CPU time)
Pyinstrument records duration using 'wall-clock' time. That means that when you're writing a program that downloads data, reads files, and talks to databases, that time is included in the tracked time by pyinstrument.
That's really important when debugging performance problems, since Python is often used as a 'glue' language between other services. The problem might not be in your program, but you should still be able to find why it's slow.
How does it work?
Pyinstrument interrupts the program every 1ms and records the entire stack at
that point. It does this using a C extension and PyEval_SetProfile, but only
taking readings every 1ms. Check out this blog post for more info.
Changelog
v2.3.0
- Big refactor!
Recordershave been removed. The frame recording is now internal to theProfilerobject. This means the 'frame' objects are more general-purpose, which paves the way for...- Processors! These are functions that mutate the tree to sculpt the output. They are used by the renderers to filter the output to the correct form. Now, instead of a time-aggregating recorder, the profiler just uses timeline-style recording (this is lower-overhead anyway) and the aggregation is done as a processing step.
- The upshot of this is that it's now way easier to alter the tree to filter stuff out, and do more advanced things like combining frames that we don't care about. More features to come that use this in v3.0!
- Importlib frames are removed - you won't see them at all. Their children are retained, so imports are just transparent.
- Django profile file name is now limited to a hundred of characters (#50)
- Fix bug with --html option (#53)
- Add
--versioncommand line option
v2.2.1
- Fix crash when using on the command line.
v2.2.0
-
Added support for JSON output. Use
pyinstrument --renderer=json scriptfile.py. PR -
@iddan has put together an interactive viewer using the JSON output!
-
When running
pyinstrument --htmland you don't pipe the output to a file, pyinstrument will write the console output to a temp file and open that in a browser.
v2.1.0
- Added support for running modules with pyinstrument via the command line. The new syntax
is the
-mflag e.g.pyinstrument -m module_name! PR
v2.0.4
- Fix crashes due to multi-threaded use of pyinstrument. The fix is in the C extension, over at https://github.com/joerick/pyinstrument_cext/pull/3
v2.0.3
-
Pyinstrument can now be used in a
withblock.For example:
profiler = pyinstrument.Profiler() with profiler: # do some work here... print(profiler.output_text()) -
Middleware fix for older versions of Django
v2.0.2
- Fix for max recursion error when used to profile programs with a lot of frames on the stack.
v2.0.1
- Ensure license is included in the sdist.
v2.0.0
-
Pyinstrument uses a new profiling mode. Rather than using signals, pyintrument uses a new statistical profiler built on PyEval_SetProfile. This means no more main thread restriction, no more IO errors when using Pyinstrument, and no need for a separate more 'setprofile' mode!
-
Renderers. Users can customize Pyinstrument to use alternative renderers with the
rendererargument onProfiler.output(), or using the--rendererargument on the command line. -
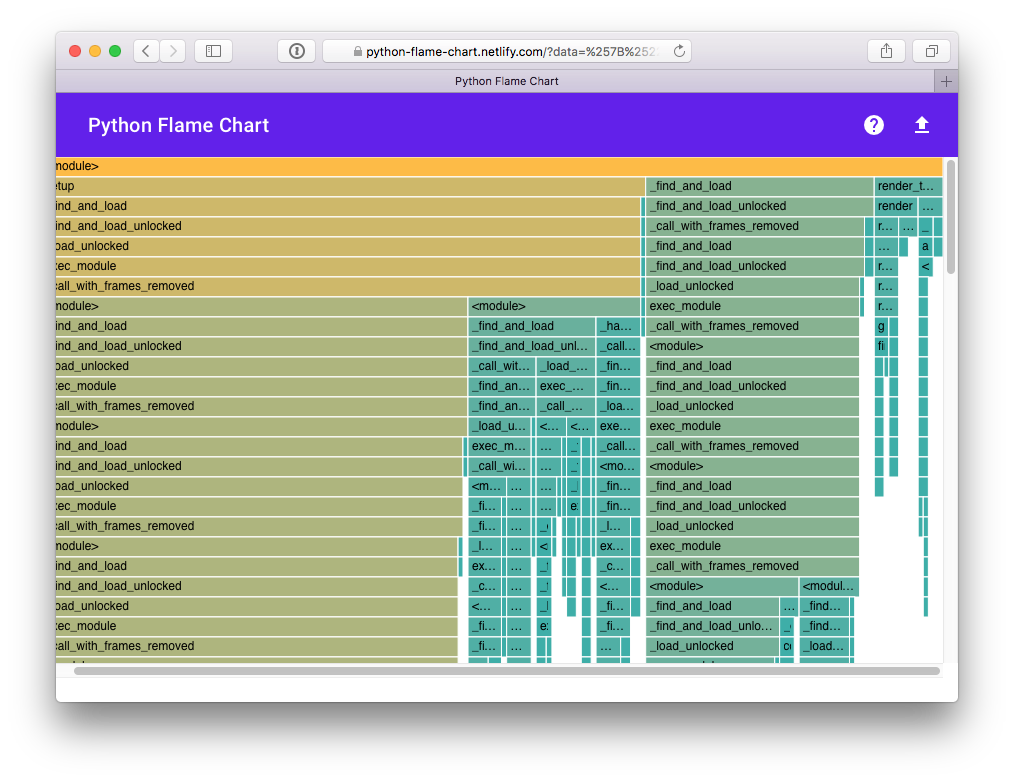
Recorders. To support other use cases of Pyinstrument (e.g. flame charts), pyinstrument now has a 'timeline' recorder mode. This mode records captured frames in a linear way, so the program execution can be viewed on a timeline.
v0.13
pyinstrumentcommand. You can now profile python scripts from the shell by running$ pyinstrument script.py. This is now equivalent topython -m pyinstrument. Thanks @asmeurer!
v0.12
-
Application code is highlighted in HTML traces to make it easier to spot
-
Added
PYINSTRUMENT_PROFILE_DIRoption to the Django interface, which will log profiles of all requests to a file the specified folder. Useful for profiling API calls. -
Added
PYINSTRUMENT_USE_SIGNALoption to the Django interface, for use when signal mode presents problems.
Contributing
To setup a dev envronment, do:
virtualenv --python=python3 env
. env/bin/activate
pip install -r requirements-dev.txt
Note: if you get an SSL error doing the above, it might be due to setuptools trying to install pytest-runner, since it's listed in setup_requires. The workaround is to make sure your pip is up-to-date (
curl https://bootstrap.pypa.io/get-pip.py | python) and then install it firstpip install pytest-runner. Then trypip install -r requirements-dev.txt.
To get some sample output:
pyinstrument examples/wikipedia_article_word_count.py
To run the tests:
python setup.py test
Release history Release notifications | RSS feed


Download files
Download the file for your platform. If you're not sure which to choose, learn more about installing packages.
Source Distributions
Built Distribution
Hashes for pyinstrument-3.0.0b3-py2.py3-none-any.whl
| Algorithm | Hash digest | |
|---|---|---|
| SHA256 | bb850b9aeede30a8d99244f57c3cfc8c60bb81eacf027bd3358131c3c8da1917 |
|
| MD5 | 8807adf21b798a6f23779d6a847564cb |
|
| BLAKE2b-256 | 78b98285766f0eef93c8b108090d079fce4393609e342b8e8f76de44c3665a5a |


