playing with metrics

Project description

pytheus
playing with metrics
Experimenting with a different way of creating prometheus metrics in python:
- support for default labels value ✅
- partial labels value (built in an incremental way) ✅
- multiple multiprocess support:
- mmap file based (wip ⚠️)
- redis backend ✅
- customizable registry support ✅
- registry prefix support ✅
Install
pip install pytheus
Optionally if you want to use the Redis backend you will need the redis library:
pip install redis
# or
pip install pytheus[redis]
Partial labels support:
from pytheus.metrics import Counter

# without labels
my_metric = Counter('metric_name', 'desc')
my_metric.inc()  # example for counter

# with labels
my_metric = Counter('metric_name', 'desc', required_labels=['req1', 'req2'])

my_metric.labels({'req1': '1', 'req2': '2'}).inc()  # you can pass all the labels at once
partial_my_metric = my_metric.labels({'req1': '1'})  # a cacheable object with one of the required labels already set
observable_my_metric = partial_my_metric.labels({'req2': '2'})  # finish setting the remaining values before observing
observable_my_metric.inc()
Default labels support:
from pytheus.metrics import Counter

# with default labels
my_metric = Counter('metric_name', 'desc', required_labels=['req1', 'req2'], default_labels={'req2': 'me_set!'})

my_metric.labels({'req1': '1'}).inc()  # as we have req2 as a default label we only need to set the remaining labels for observing
my_metric.labels({'req1': '1', 'req2': '2'})  # you can still override default labels!
Exposing metrics:
You can use the generate_metrics function from pytheus.exposition to generate the metrics and serve them as an endpoint with your favourite web framework.
Alternatively you can use the make_wsgi_app function that creates a simple wsgi app to serve the metrics.
Quickstart / Example
The example.py file starts a flask application with three endpoints:
/: just returns a phrase while observing the time taken for the request to complete/slow: same as before but will sleep so that values will only end up in higher buckets/metrics: the endpoint used by prometheus to scrape the metrics
It uses two histograms, one without labels, and one with labels required and a default label that makes it observable.
To expose the metrics the generate_metrics() function is used.
note: the example file is using the redis backend but you can try without and set up prometheus yourself.
Redis version
For the redis version you can just clone the repository and run docker-compose up to start both redis and prometheus scraping on localhost:8080.
Then you can start the local server with python example.py. (flask is required for it to work)
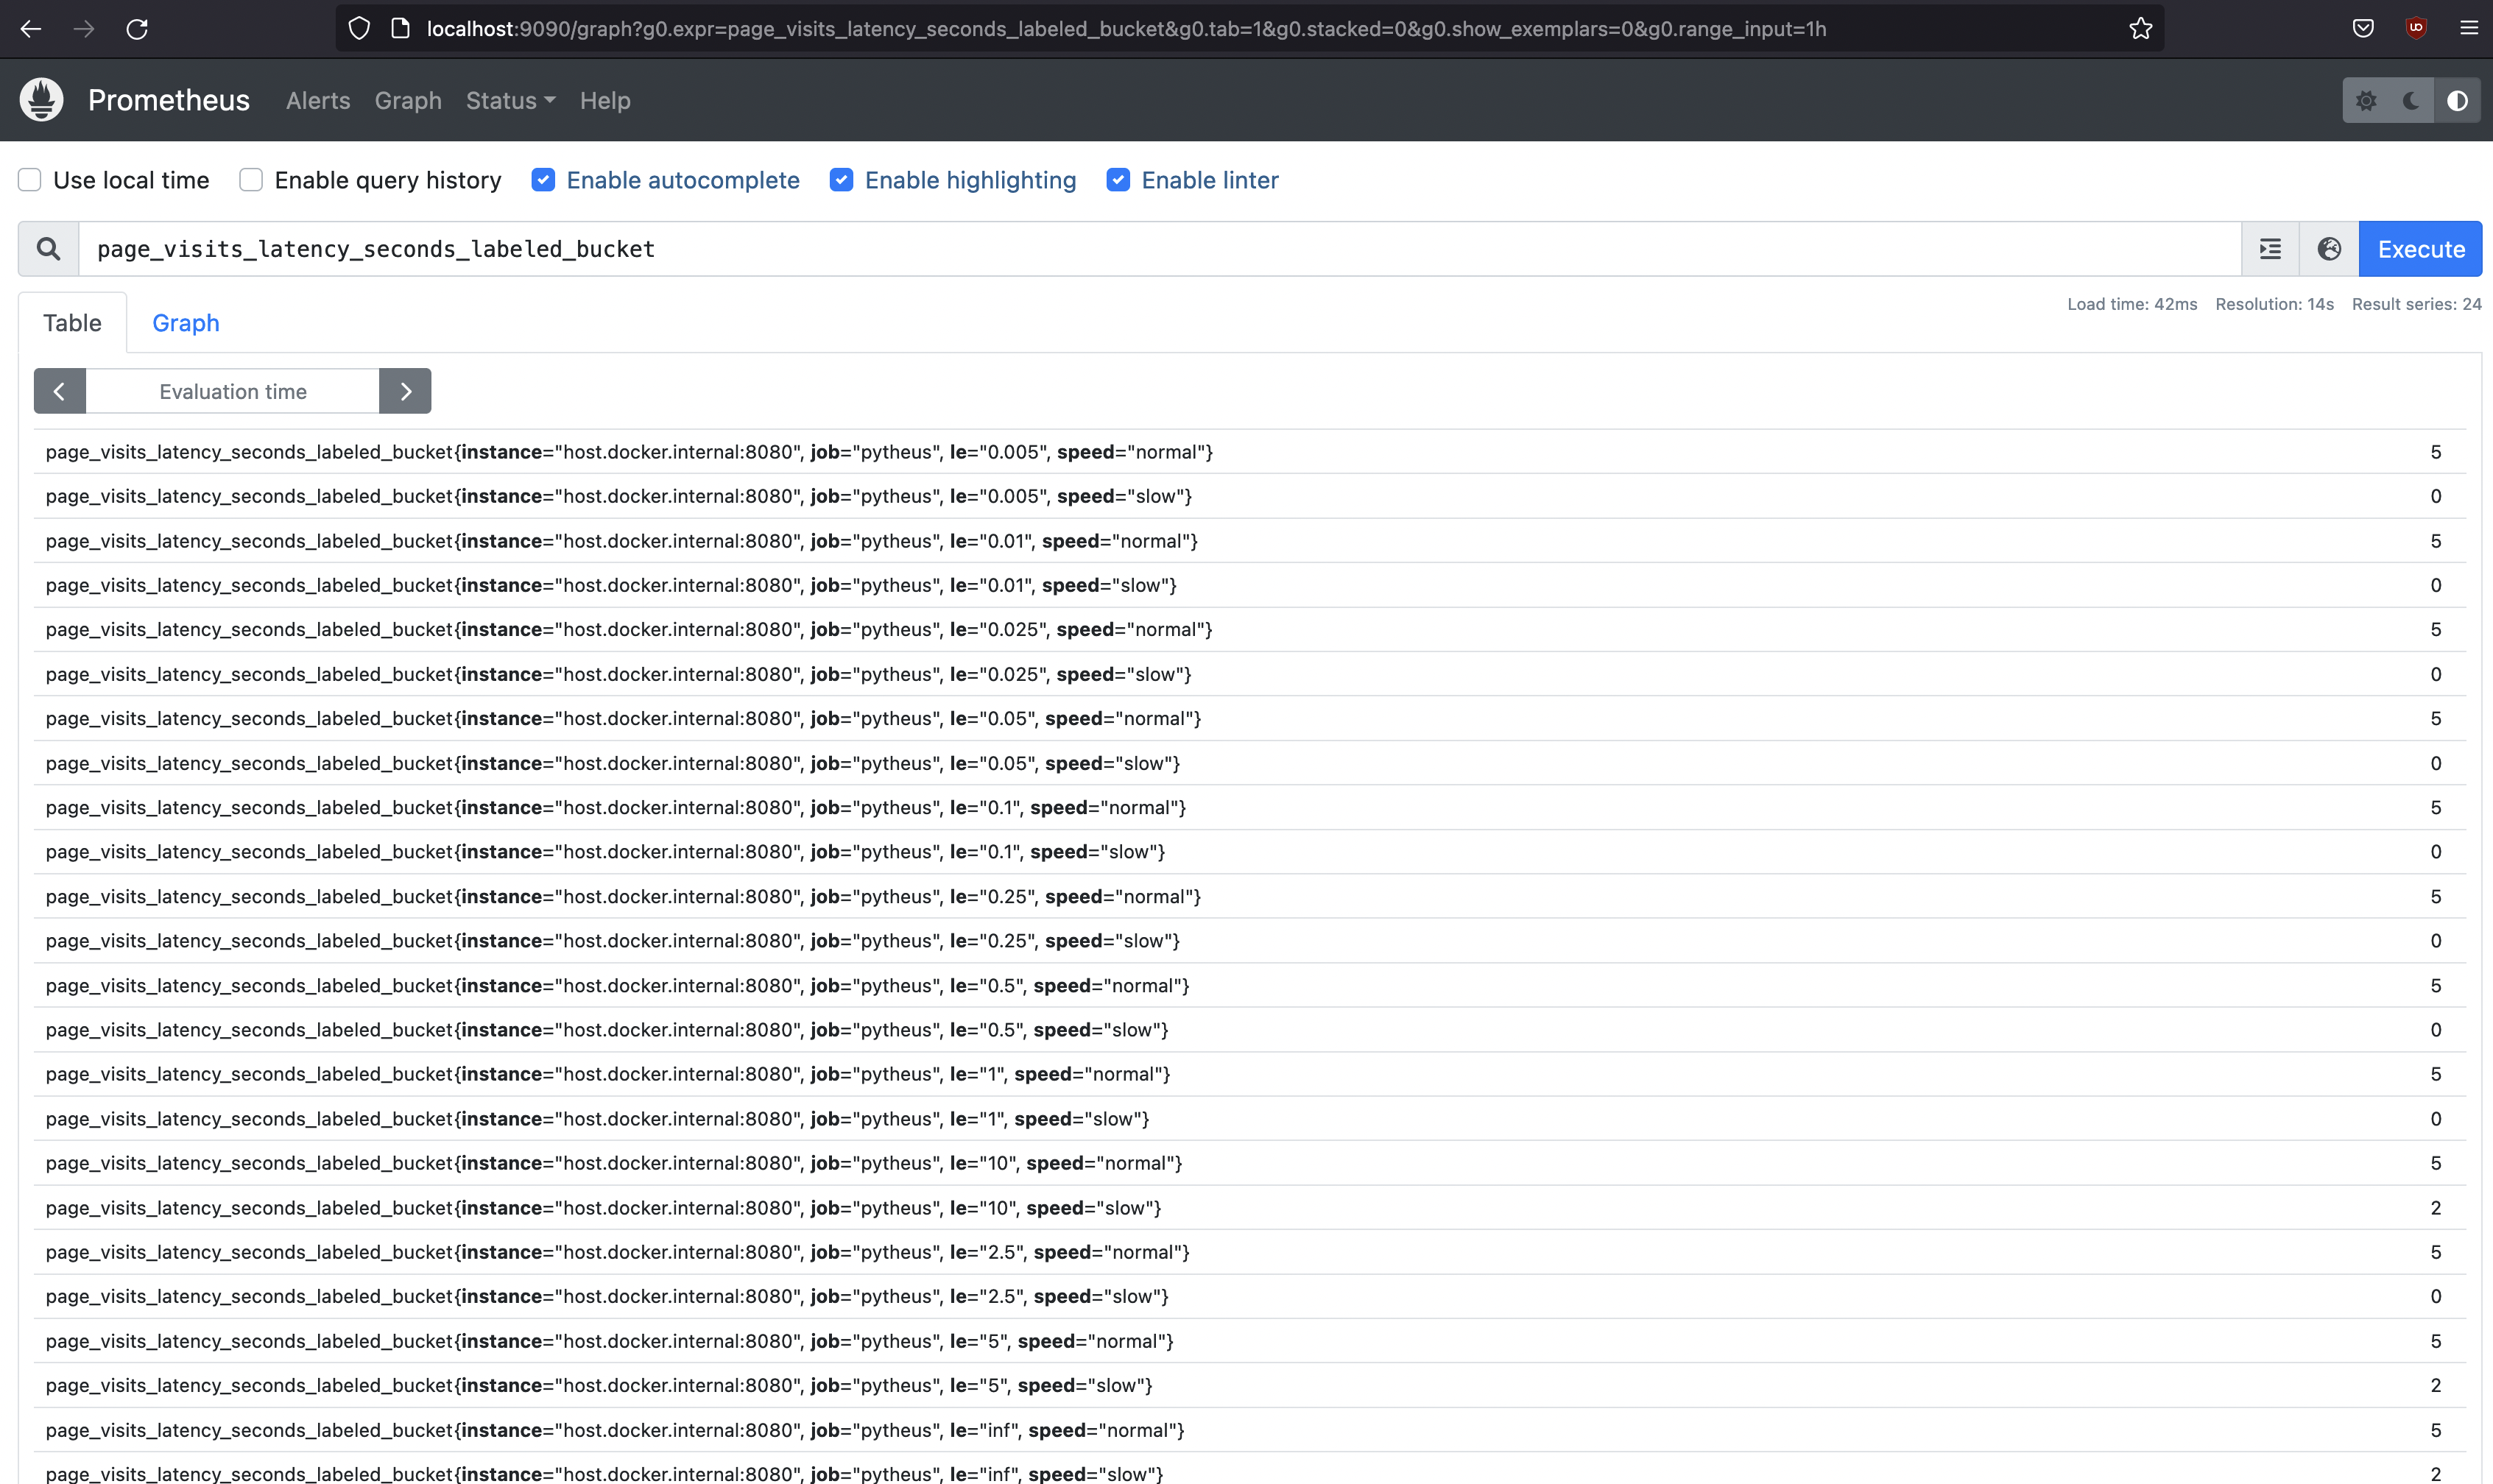
Now you can visit the described endpoints and by visiting localhost:9090 you can query prometheus, for example by looking for all the slow requests buckets: page_visits_latency_seconds_labeled_bucket{speed="slow"}
Default version
For the default single process version you can create your python server like this:
import time
from flask import Flask
from pytheus.metrics import Histogram
from pytheus.exposition import generate_metrics

app = Flask(__name__)

histogram = Histogram('page_visits_latency_seconds', 'used for testing')

# this is the endpoint that prometheus will use to scrape the metrics
@app.route('/metrics')
def metrics():
    return generate_metrics()

@app.route('/')
def home():
    with histogram.time():
        return 'hello world!'

@app.route('/slow')
def slow():
    with histogram.time():
        time.sleep(3)
        return 'hello world! from slow!'

app.run(host='0.0.0.0', port=8080)
and if you have prometheus installed configure it to scrape on localhost:8080 or you can still use the included docker-compose.yml file.
Metric types
Counter
The Counter is a metric that only increases and can resets to 0. (For example if a service restart, it will start again from zero)
from pytheus.metrics import Counter

counter = Counter(name="my_counter", description="My description")

# increase by 1
counter.inc()

# increase by x
counter.inc(7)

# it is possible to count exceptions
with counter.count_exceptions():
    raise ValueError  # increases counter by 1

# you can specify which exceptions to watch for
with counter.count_exceptions((IndexError, ValueError)):
    raise ValueError. # increases counter by 1

# it is possible to use the counter as a decorator as a shortcut to count exceptions
@counter
def test():
    raise ValueError  # increases counter by 1 when called

# specifying which exceptions to look for also works with the decorator
@counter(exceptions=(IndexError, ValueError))
def test():
    raise ValueError  # increases counter by 1 when called
Gauge
The Gauge can increase and decrease its value. It is also possible to set a specific value.
from pytheus.metrics import Gauge

gauge = Gauge(name="my_gauge", description="My description")

# increase by 1
gauge.inc()

# increase by x
gauge.inc(7)

# decrease by 1
gauge.dec()

# set a specific value
gauge.set(7)

# set to current unix timestamp
gauge.set_to_current_time()

# it is possible to track progress so that when entered increases the value by 1, and when exited decreases it
with gauge.track_inprogress():
    do_something()

# you can also time a piece of code, will set the duration in seconds to value when exited
with gauge.time():
    do_something()

# tracking time can also be done as a decorator
@gauge
def do_something():
    ...
Histogram
A histogram samples observations (usually things like request durations or response sizes) and counts them in configurable buckets. It also provides a sum of all observed values. (taken from prometheus docs)
from pytheus.metrics import Histogram

histogram = Histogram(name="my_histogram", description="My description")
# by default it will have the following buckets: (.005, .01, .025, .05, .1, .25, .5, 1, 2.5, 5, 10)
# note: the +Inf bucket will be added automatically, this is float('inf') in python

# create a histogram specifying buckets
histogram = Histogram(name="my_histogram", description="My description", buckets=(0.2, 1, 3))

# observe a value
histogram.observe(0.4)

# you can also time a piece of code, will set the duration in seconds to value when exited
with histogram.time():
    do_something()

# tracking time can also be done as a decorator
@histogram
def do_something():
    ...
How to use different backends
Things work out of the box, using the SingleProcessBackend:
from pytheus.metrics import Counter

counter = Counter(
    name="my_metric",
    description="My description",
    required_labels=["label_a", "label_b"],
)
print(counter._metric_value_backend.__class__)
# <class 'pytheus.backends.SingleProcessBackend'>
print(counter._metric_value_backend.config)
# {}
You can define environment configuration to have different defaults, using two environment variables:
export PYTHEUS_BACKEND_CLASS="pytheus.backends.MultipleProcessFileBackend"
export PYTHEUS_BACKEND_CONFIG="./config.json"
Now, create the config file, ./config.json:
{
  "pytheus_file_directory": "./"
}
Now we can try the same snippet as above:
from pytheus.metrics import Counter

counter = Counter(
    name="my_metric",
    description="My description",
    required_labels=["label_a", "label_b"],
)
print(counter._metric_value_backend.__class__)
# <class 'pytheus.backends.MultipleProcessFileBackend'>
print(counter._metric_value_backend.config)
# {'pytheus_file_directory': "./"}
You can also pass the values directly in Python, which would take precedence over the environment setup we have just described:
from pytheus.metrics import Counter
from pytheus.backends import MultipleProcessRedisBackend, load_backend

load_backend(
    backend_class=MultipleProcessRedisBackend,
    backend_config={
      "host": "127.0.0.1",
      "port":  6379
    }
)
# Notice that if you simply call load_backend(), it would reload config from the environment.

# load_backend() is called automatically at package import, that's why we didn't need to call it
# directly in the previous example

counter = Counter(
    name="my_metric",
    description="My description",
    required_labels=["label_a", "label_b"],
)
print(counter._metric_value_backend.__class__)
# <class 'pytheus.backends.MultipleProcessRedisBackend'>
print(counter._metric_value_backend.config)
# {'host': '127.0.0.1', 'port': 6379}
Release history Release notifications | RSS feed


Download files
Download the file for your platform. If you're not sure which to choose, learn more about installing packages.


