PyVista DataArray accessors for xarray

Project description
PyVista xarray
PyVista DataArray accessor for xarray to visualize datasets in 3D
🚀 Usage
You must import pvxarray in order to register the DataArray accessor with
xarray. After which, a pyvista_* namespace of accessors will be available.
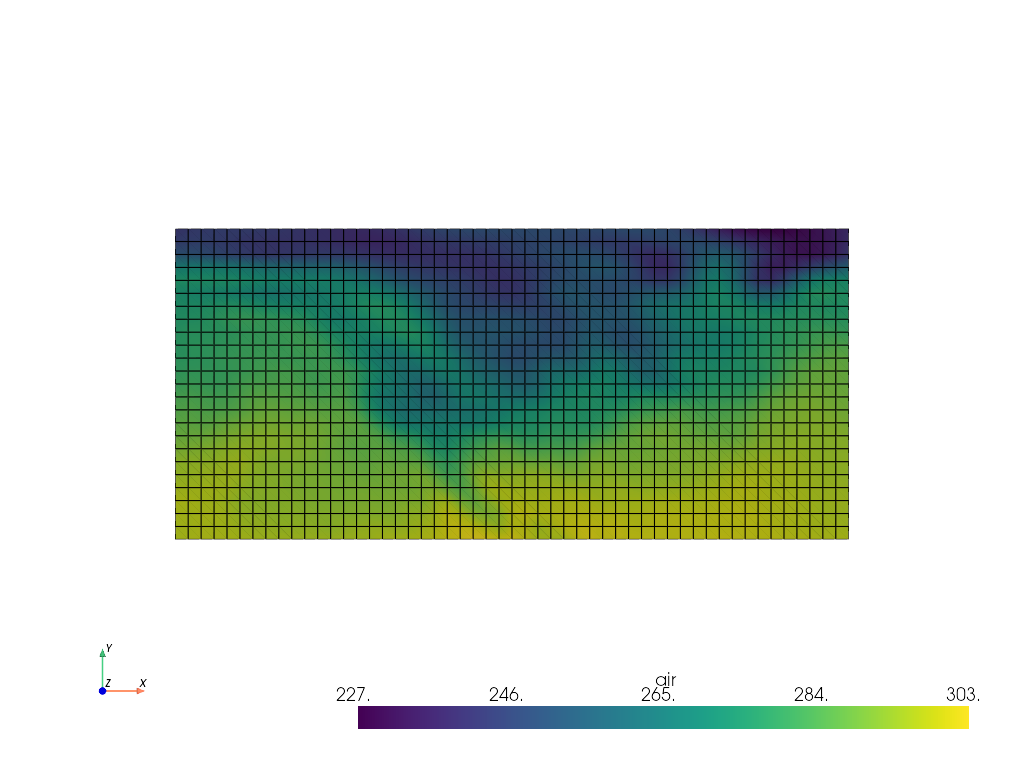
The following is an example to visualize a RectilinearGrid with PyVista:
import pvxarray
import xarray as xr

ds = xr.tutorial.load_dataset("air_temperature")
da = ds.air[dict(time=0)]  # Select DataArray for a timestep

# Plot in 3D
da.pyvista.plot(show_edges=True, cpos='xy')

# Or grab the mesh object for use with PyVista
mesh = da.pyvista.mesh
⬇️ Installation
pip install pyvista-xarray
💭 Feedback
Please share your thoughts and questions on the Discussions board. If you would like to report any bugs or make feature requests, please open an issue.
If filing a bug report, please share a scooby Report:
import pvxarray
print(pvxarray.Report())
🏏 Further Examples
Simple RectilinearGrid
import numpy as np
import pvxarray
import xarray as xr

lon = np.array([-99.83, -99.32])
lat = np.array([42.25, 42.21])
z = np.array([0, 10])
temp = 15 + 8 * np.random.randn(2, 2, 2)

ds = xr.Dataset(
    {
        "temperature": (["z", "x", "y"], temp),
    },
    coords={
        "lon": (["x"], lon),
        "lat": (["y"], lat),
        "z": (["z"], z),
    },
)

mesh = ds.temperature.pyvista.mesh
mesh.plot()
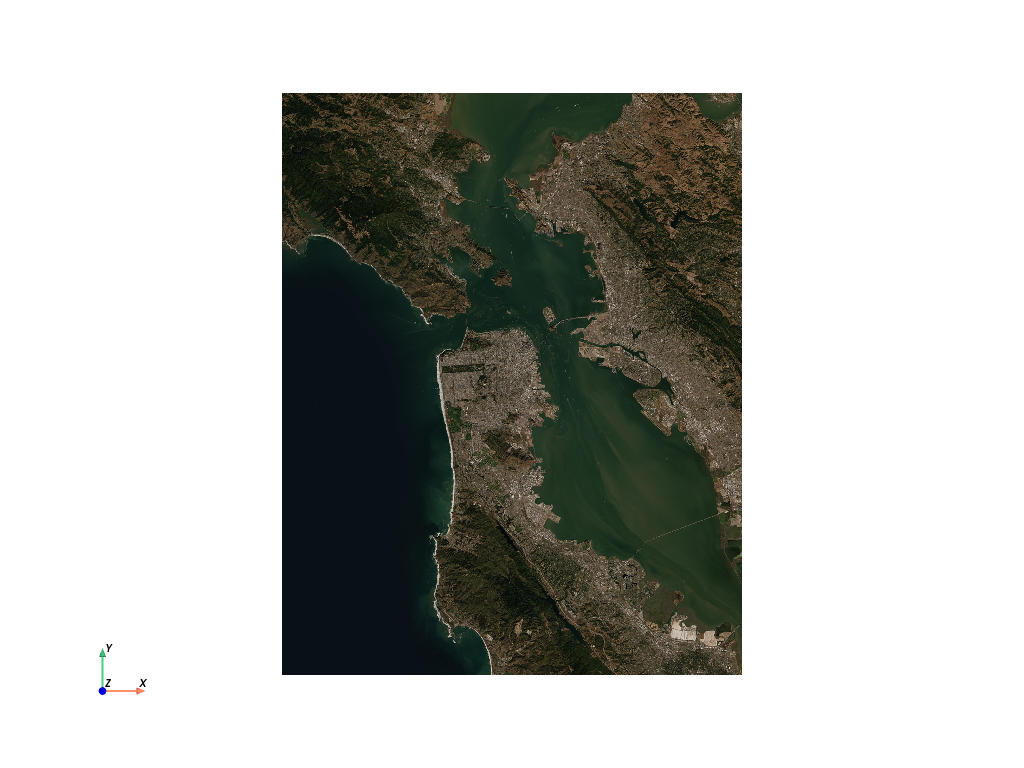
Raster with rioxarray
import pvxarray
import rioxarray
import xarray as xr

da = rioxarray.open_rasterio("TC_NG_SFBay_US_Geo_COG.tif")
da = da.rio.reproject("EPSG:3857")

# Grab a single band
band = da[dict(band=0)]

# Grab the mesh object for use with PyVista
mesh = band.pyvista.mesh

mesh.plot(cpos='xy')
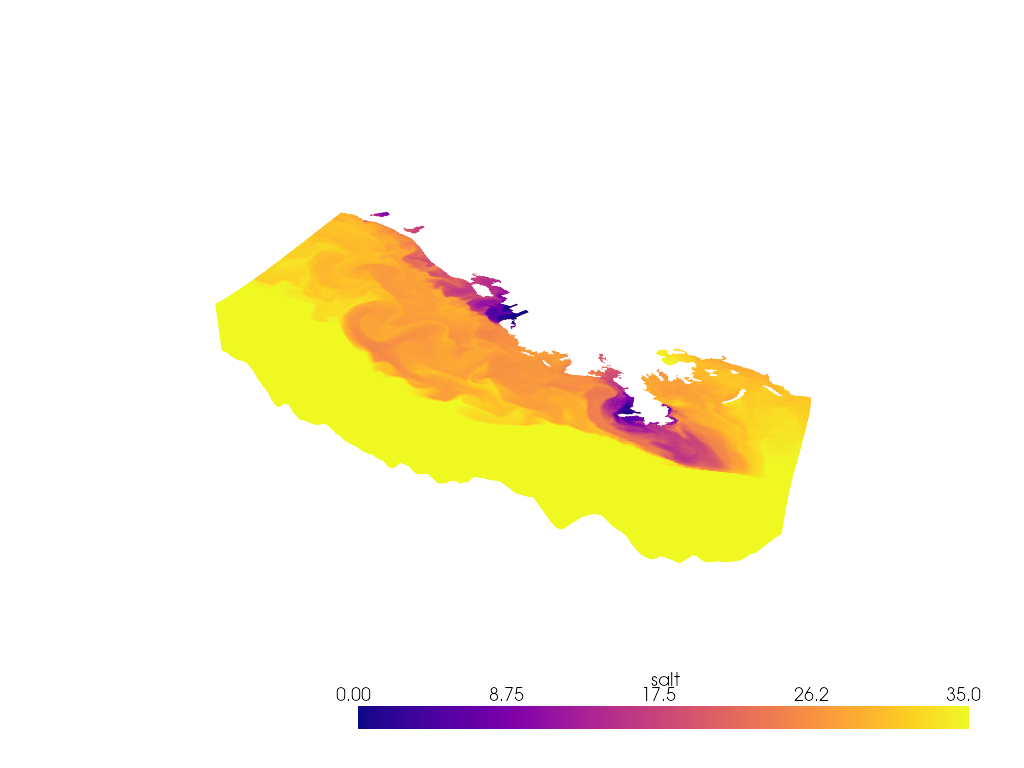
StructuredGrid
import pvxarray
import rioxarray

ds = xr.tutorial.open_dataset("ROMS_example.nc", chunks={"ocean_time": 1})

if ds.Vtransform == 1:
    Zo_rho = ds.hc * (ds.s_rho - ds.Cs_r) + ds.Cs_r * ds.h
    z_rho = Zo_rho + ds.zeta * (1 + Zo_rho / ds.h)
elif ds.Vtransform == 2:
    Zo_rho = (ds.hc * ds.s_rho + ds.Cs_r * ds.h) / (ds.hc + ds.h)
    z_rho = ds.zeta + (ds.zeta + ds.h) * Zo_rho

ds.coords["z_rho"] = z_rho.transpose()  # needing transpose seems to be an xarray bug

da = ds.salt[dict(ocean_time=0)]

# Make array ordering consistent
da = da.transpose("s_rho", "xi_rho", "eta_rho", transpose_coords=False)

# Set coordinate names
da.pyvista_structured.x_coord = "lon_rho"
da.pyvista_structured.y_coord = "lat_rho"
da.pyvista_structured.z_coord = "z_rho"

# Grab StructuredGrid mesh
mesh = da.pyvista_structured.mesh

# Plot in 3D
p = pv.Plotter()
p.add_mesh(mesh, lighting=False, cmap='plasma', clim=[0, 35])
p.view_vector([1, -1, 1])
p.set_scale(zscale=0.001)
p.show()


Download files
Download the file for your platform. If you're not sure which to choose, learn more about installing packages.
Source Distribution
pyvista-xarray-0.0.1.tar.gz
(845.7 kB
view hashes)
Built Distribution
pyvista_xarray-0.0.1-py3-none-any.whl
(848.1 kB
view hashes)
Close
Hashes for pyvista_xarray-0.0.1-py3-none-any.whl
| Algorithm | Hash digest | |
|---|---|---|
| SHA256 | 019721eabc0b2099d062c2f9905a581a8e8e812d916dad01c502b60c31aa2bee |
|
| MD5 | cc89aafb2a3c0f842efd20c16dfd6141 |
|
| BLAKE2b-256 | 0ee6cd0af1009c41d9d83108e1b2b0b596a856f279f87e19f1553cea4fd00ac5 |


