A fast line-by-line code for high-resolution infrared molecular spectra

Project description
| Users:


| Devs :


RADIS
RADIS is a fast line-by-line code for high resolution infrared molecular spectra (emission / absorption, equilibrium / nonequilibrium).
Includes post-processing tools to compare experimental spectra and spectra calculated with RADIS or other spectral codes.
User guide, install procedure and examples are available on the RADIS Website:
Getting Started
Install
Assuming you have Python installed with the Anaconda distribution just use:
pip install radis
That's it! You can now run your first example below. If you encounter any issue, or to upgrade the package later, please refer to the detailed installation procedure .
Quick Start
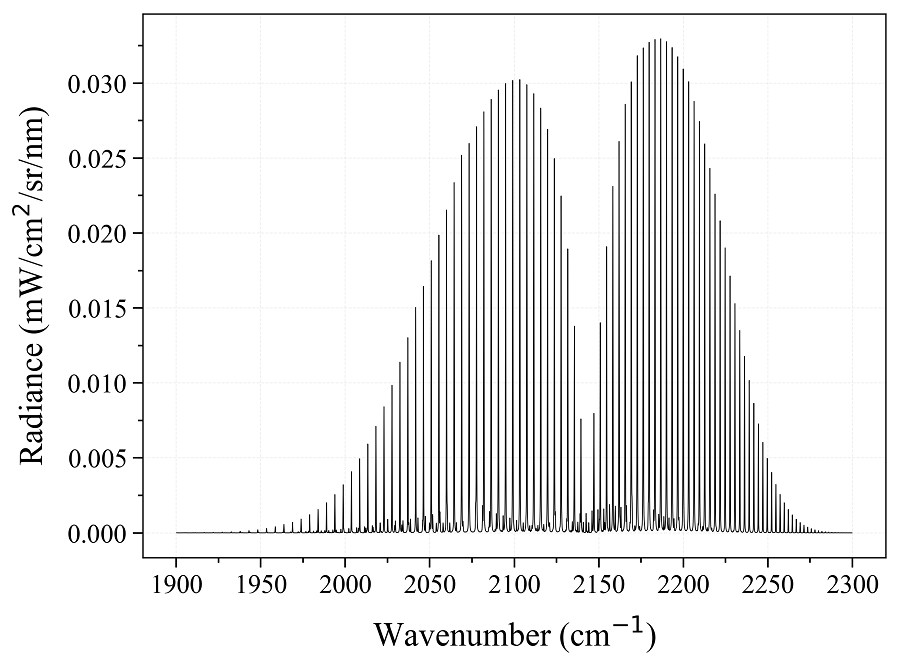
Calculate a CO equilibrium spectrum from the HITRAN database, using the calc_spectrum function. Output is a Spectrum object: :
from radis import calc_spectrum
s = calc_spectrum(1900, 2300,         # cm-1
                  molecule='CO',
                  isotope='1,2,3',
                  pressure=1.01325,   # bar
                  Tgas=700,           # K
                  mole_fraction=0.1,
                  path_length=1,      # cm
                  )
s.apply_slit(0.5, 'nm')       # simulate an experimental slit
s.plot('radiance')
Calculate a CO nonequilibrium spectrum from the HITRAN database (on your first call, this will calculate and cache the CO(X) rovibrational energies): :
s2 = calc_spectrum(1900, 2300,         # cm-1
                  molecule='CO',
                  isotope='1,2,3',
                  pressure=1.01325,   # bar
                  Tvib=700,           # K
                  Trot=300,           # K
                  mole_fraction=0.1,
                  path_length=1,      # cm
                  )
s2.apply_slit(0.5, 'nm')
s2.plot('radiance', nfig='same')    # compare with previous
The Quick Start examples automatically download the line databases from
HITRAN-2016,
which is valid for temperatures below 700 K. For high temperature
cases, you may need to use other line databases such as
HITEMP-2010
(typically T < 2000 K) or
CDSD-4000
(T < 5000 K). These databases must be described in a ~/.radis
Configuration
file.
More complex examples will require to use the SpectrumFactory class, which is the core of RADIS line-by-line calculations. calc_spectrum is a wrapper to SpectrumFactory for the simple cases.
Experimental spectra can be loaded using the experimental_spectrum function and compared with the plot_diff function. For instance:
from numpy import loadtxt
from radis import experimental_spectrum, plot_diff
w, I = loadtxt('my_file.txt').T    # assuming 2 columns
sexp = experimental_spectrum(w, I, Iunit='mW/cm2/sr/nm')
plot_diff(sexp, s)    # comparing with spectrum 's' calculated previously
Typical output of plot_diff:

Refer to the Examples section for more examples, and to the Spectrum page for more post-processing functions.
In the browser (no installation needed!)
Alternatively, you can also run RADIS directly in the browser with the RADIS Interactive Examples project. For instance, run the Quick Start example on the link below:
Or start a bare RADIS online session:
Cite
Article is available at
For reproducibility, do not forget to cite the line database used, and the spectroscopic constants if running nonquilibrium calculations. See How to cite?
Developer Guide
Architecture
RADIS internals are described in the Developer Guide

License
The code is available on this repository under GNU LESSER GENERAL
PUBLIC LICENSE (v3)
Support
If encountering any problem, first refer to the list of known Issues on GitHub. We appreciate your feedback and suggestions!
For any question, please join the discussion channel on Gitter:
References
Links
- Documentation:
- Help:
- Article:
- Source Code:
- Test Status:
- PyPi Repository:
- Interactive Examples:
radis_examples


Other Spectroscopic tools
See awesome-spectra


Release history Release notifications | RSS feed


Download files
Download the file for your platform. If you're not sure which to choose, learn more about installing packages.
Source Distribution
Built Distribution
Hashes for radis-0.9.22-py2.py3-none-any.whl
| Algorithm | Hash digest | |
|---|---|---|
| SHA256 | bfd5dd3940fa56d087cd51ad5a3dc1a1738cae2d3428a2f63846f622a5398727 |
|
| MD5 | c980b370ce9a6e600e8be7d65878fcc0 |
|
| BLAKE2b-256 | a2552a3aff4250d3c9f090a041501ad6a8e68d1b45cfbfa28673b6db71a4e827 |


