User-friendly access (i.e. APIs) for various Mars datasets and derived geophysics quantities. Create publication-ready plots on the fly or access the underlying data for more involved calculations.

Project description
RedPlanet
RedPlanet is a Python package that gives an easy way to work with various Mars datasets. With straightforward methods and high customizability, you can either create publication-ready plots on the fly, or access the underlying data for more involved calculations.
Usage:
Install with pip install redplanet.
GRS
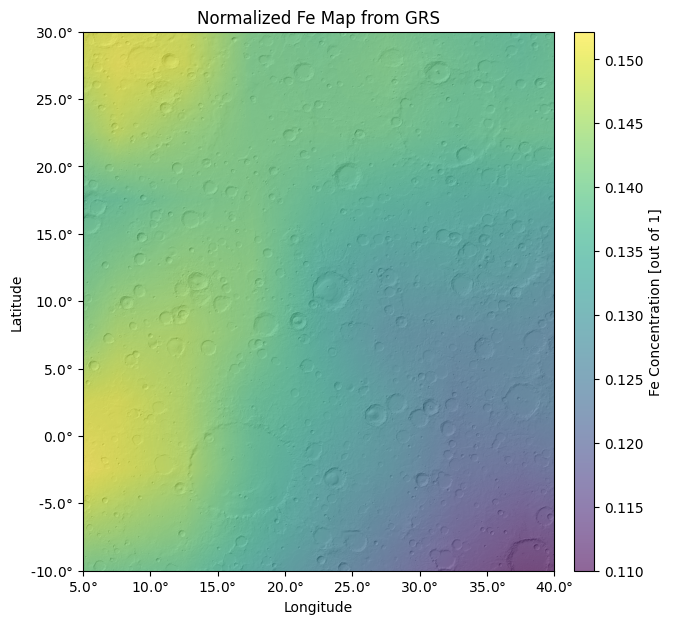
Access/visualize chemical abundance maps derived from the 2001 Mars Odyssey Gamma Ray Spectrometer. The original data is defined in 5 degree bins, but this module allows you to programmatically estimate values at exact coordinates by interpolating between points. Concentrations can be extracted for both the shallow subsurface (raw data) and bulk crustal composition (normalized to volatile-free basis, i.e. zero H2O/Cl/Si).
- Example 1: Iron concentrations in Arabia Terra. Data is normalized to a volatile-free basis (H2O/Cl/Si free), so it is representative of the bulk crustal composition rather than shallow subsurface.
Recreate with:
from redplanet import GRS
GRS.visualize(
  element_name='fe',
  normalize=True,
  lon_bounds=(5,40),
  lat_bounds=(-10,30),
  grid_spacing=0.1,
  overlay=True
)
Crust
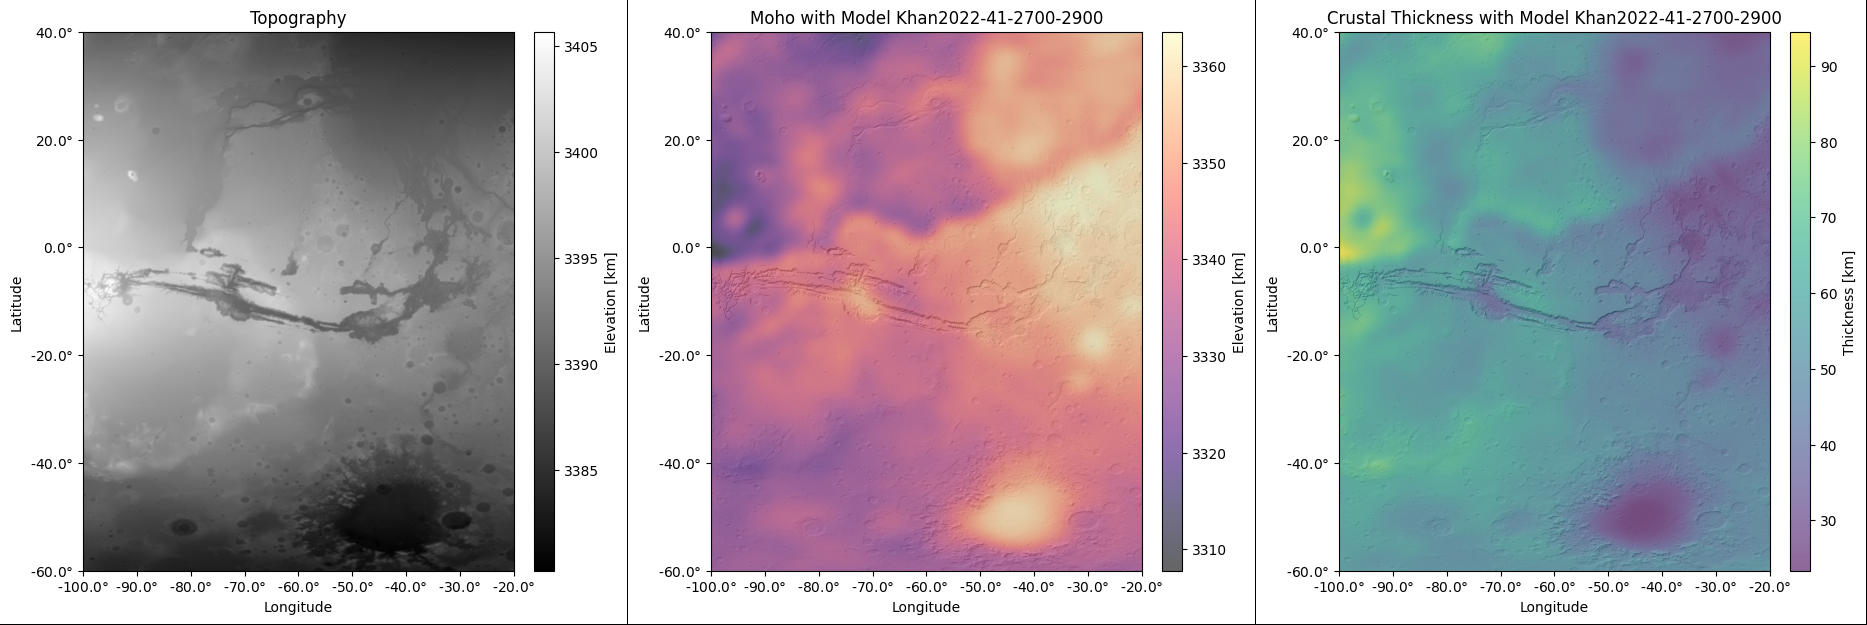
Access/visualize maps of topography, Moho, crustal thickness, and crustal density from spherical harmonics. We offer ~22,000 models of the crust-mantle interface parameterized by reference interior models, crustal thickness at the InSight landing, and homogeneous/inhomogeneous crustal densities across the dichotomy.
- Example 1: Topography, Moho, and crustal thickness of the Valles Marineris region. Model parameters are 41 km crustal thickness at the InSight landing, 2,900 kg/m^3 crustal density in the North, and 2,700 kg/m^3 crustal density in the South.
Recreate with:
from redplanet import Crust
lons = (-100,-20)
lats = (-60,40)
Crust.load_model(RIM='Khan2022', insight_thickness=41, rho_north=2900, rho_south=2700)
Crust.visualize(quantity='topo', lon_bounds=lons, lat_bounds=lats, grid_spacing=0.1)
Crust.visualize(quantity='moho', lon_bounds=lons, lat_bounds=lats, overlay=True, grid_spacing=0.3)
Crust.visualize(quantity='thick', lon_bounds=lons, lat_bounds=lats, overlay=True, grid_spacing=0.3)
- Example 2: Crustal thickness profile of Henry Crater with various crust-mantle interface models.
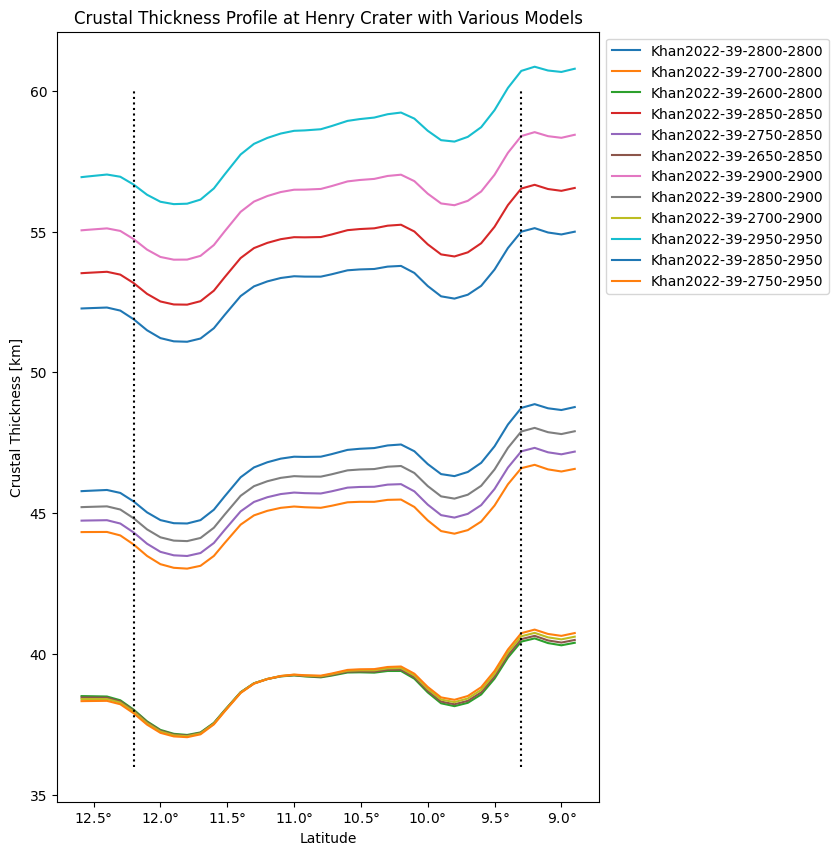
Recreate with: See section 2.2 in demo.ipynb.
Documentation
For a more in-depth tutorial in interactive notebook format, see demo.ipynb.
Links
- Don't hesitate to reach out: zain.eris.kamal@rutgers.edu
- Acknowledgements: docs/thanks.txt
- References: docs/references.txt
- Other work: github.com/Humboldt-Penguin
Release history Release notifications | RSS feed

Download files
Download the file for your platform. If you're not sure which to choose, learn more about installing packages.
Source Distribution
Built Distribution
Hashes for redplanet-1.0.0-py3-none-any.whl
| Algorithm | Hash digest | |
|---|---|---|
| SHA256 | 5cbf35e892c5d6cefc3c9ef695a5467991b25176117d521a08740fd990f321e7 |
|
| MD5 | 746e3aa773582e2daa667530cb50a70e |
|
| BLAKE2b-256 | ec41d6511a28e3bea32c9f8cb5634d10dd2051f1f7fc19144d4e78b8ef0bb06b |


