Identifies rivers in satellite images and generates a path of pixel values along its length.

Project description
River Trace
Identifies rivers in satellite images and generates a profile of pixel values along its length.
Installation
Install from PYPI
pip install rivertrace
Install from GitHub
- Clone the repository to your local machine using the command:
git clone git@github.com:JamesRunnalls/river-trace.git
Note that the repository will be copied to your current working directory.
- Use Python 3 and install the requirements with:
pip install -r requirements.txt
The python version can be checked by running the command python --version. In case python is not installed or only an older version of it, it is recommend to install python through the anaconda distribution which can be downloaded here.
Usage
River trace can be used to find the shortest path through any 2D binary array where 1 represents water and 0 represents not water.
Basic Example (source)
import numpy as np
from rivertrace import trace
from rivertrace.functions import plot_matrix

square = np.zeros((20, 20), dtype=np.uint8)
square[0:2, 0:5] = 1
square[0:8, 5:8] = 1
square[6:9, 8:12] = 1
square[8:15, 10:14] = 1
square[15:20, 12:15] = 1
square[18:20, 15:20] = 1

path = trace(square, [0, 0], [19, 19])

for p in path:
    square[p[0], p[1]] = 2

plot_matrix(square, "Final path plotted on original data")
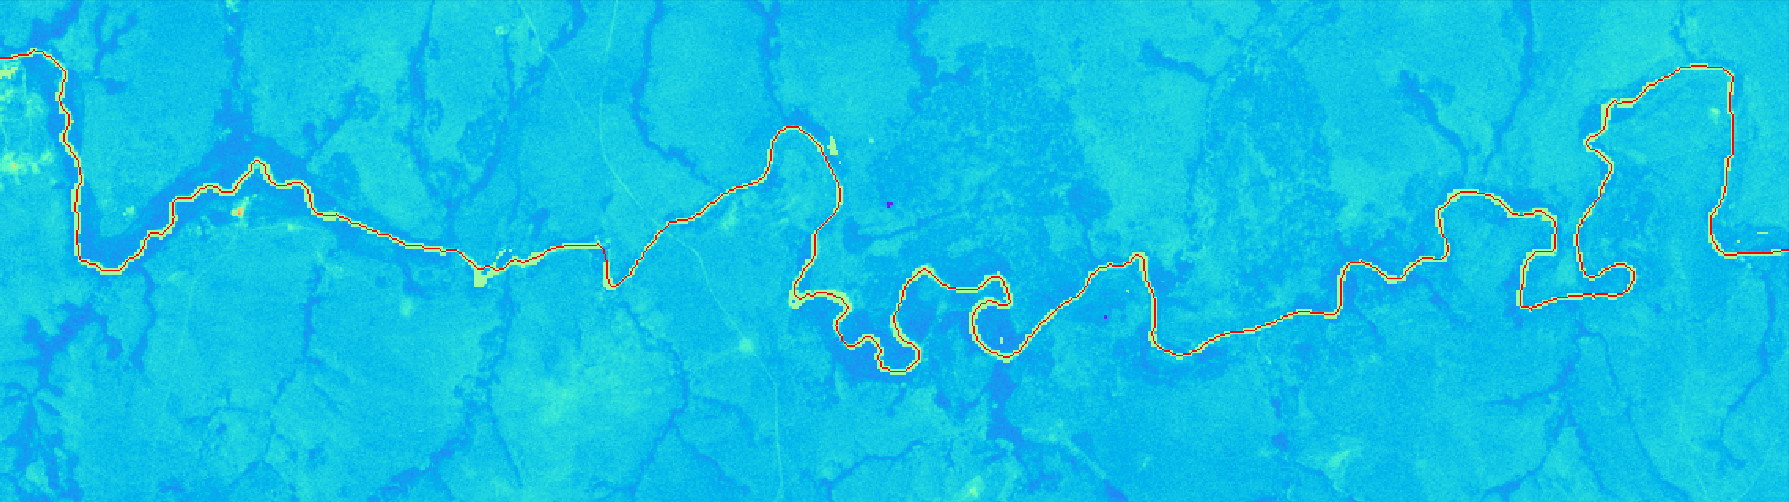
Satellite Imagery
River trace was primarily developed to trace river paths from satellite imagery. You can see an example here of how to extract data from a satellite image.
Below are the preparation steps for producing a turbidity long section using Sentinel 2 imagery.
- Download the Sentinel 2 image for your desired location and date.
- Use a processing algorithm to calculate your desired output parameter (e.g. Polymer, C2RCC, ACOLITE)
- Create a water classification band (e.g. NDWI, SWI)
- Import the band into python and convert to a binary array
- Use rivertrace to track the shortest path through the river network
How it works
River trace relies heavily on scikit-image for the initial morphological thinning of the binary matrix. This outputs a 1px wide "centerline" of available river sections.
This centerline is abstracted to nodes and edges and networkx is used to calculate the dijkstra (shortest) path through the network. This is the re-assembled as complete path. For some rivers there may be gaps in the water surface due to clouds/ bridges/ vegetation, so where a complete path is not avaialble the algorithm progressively allows greater and greater "jumps" between connected river sections.
Projects
See the following repository for examples of where river trace has been used to track river pollution events from tailings dam failures.
Release history Release notifications | RSS feed


Download files
Download the file for your platform. If you're not sure which to choose, learn more about installing packages.
Source Distribution
Built Distribution
Hashes for rivertrace-1.1.1-py3-none-any.whl
| Algorithm | Hash digest | |
|---|---|---|
| SHA256 | f64b9e0a3e54b010fb6f3f6f222310e4d22cf94feafde905769899a784ba3edc |
|
| MD5 | 8be760d9241e7f555973ccb67c430eca |
|
| BLAKE2b-256 | cceb1f76ba128524a8d719eeb047809da520ab5a5801fc5144283d66aff2f81c |


