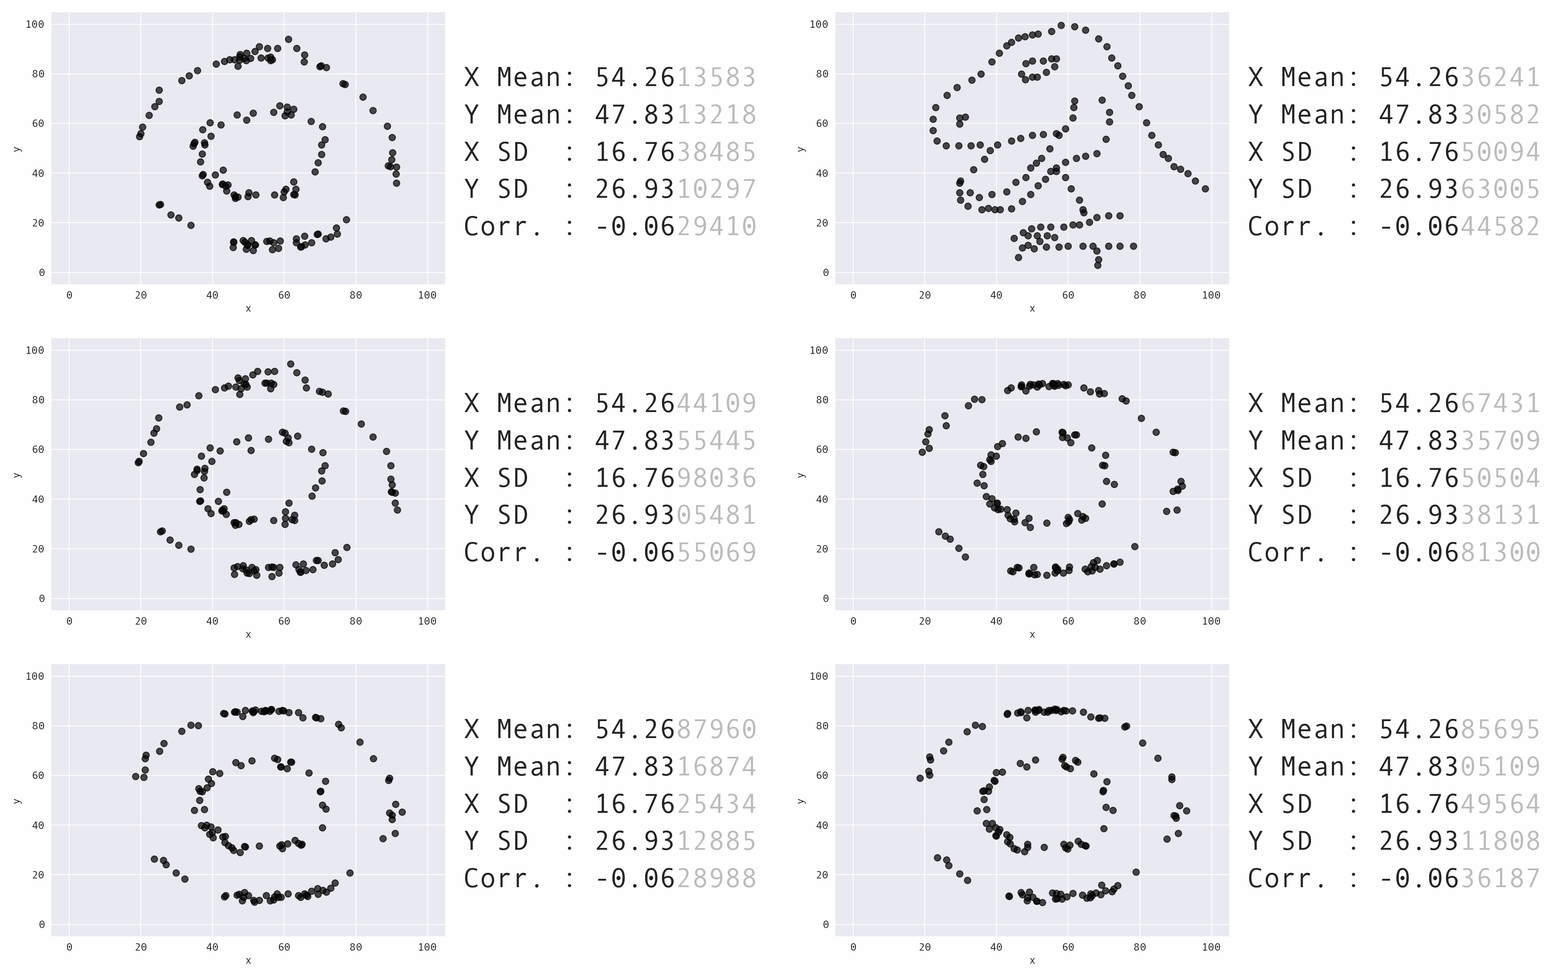
A tool to create datasets with different graphs but the same statistics
Project description
Same Stats Different Graphs
A Python tool to create datasets whose graphs are different from one another but their statistics are the same. This is a modified version of the code provided at Autodesk.
This library makes it easy for you to turn one shape to another and create GIFs for this transformation on the command line.
Installation
To install the package, type:
pip install same-stats
Usage
To turn a dinosaur shape into a bull eye shape, type:
python -m same_stats --shape_start=dino --shape_end=bullseye
And a GIF like below will be saved to the gifs directory as dino_bullseye.gif:
Argument options:
--shape_start: Shape start. Options:dino,rando,slant,big_slant--shape_end: Target shape. Options:x,h_lines,v_lines,wide_lines,high_lines,slant_up,slant_down,center,star,down_parab,circle,bullseye,dots--iters: Number of iteration--decimals: Number of decimals--frames: Number of frames
Project details
Release history Release notifications | RSS feed
Download files
Download the file for your platform. If you're not sure which to choose, learn more about installing packages.
Source Distribution
same-stats-0.1.1.tar.gz
(41.1 kB
view hashes)
Built Distribution
same_stats-0.1.1-py3-none-any.whl
(40.6 kB
view hashes)
Close
Hashes for same_stats-0.1.1-py3-none-any.whl
| Algorithm | Hash digest | |
|---|---|---|
| SHA256 | 94791c28a98474a798eeb572b2efe02c772c1019ba2040e5f44ffe122c796bbb |
|
| MD5 | 9b4b28fff25a84c923a58932e704d15a |
|
| BLAKE2b-256 | 2724383735cc269e3f74478adf5b59d42ffcc96cb3c39ee8711edecb68c1c215 |


