Interactive visualization method for ancestral recombination graphs

Project description
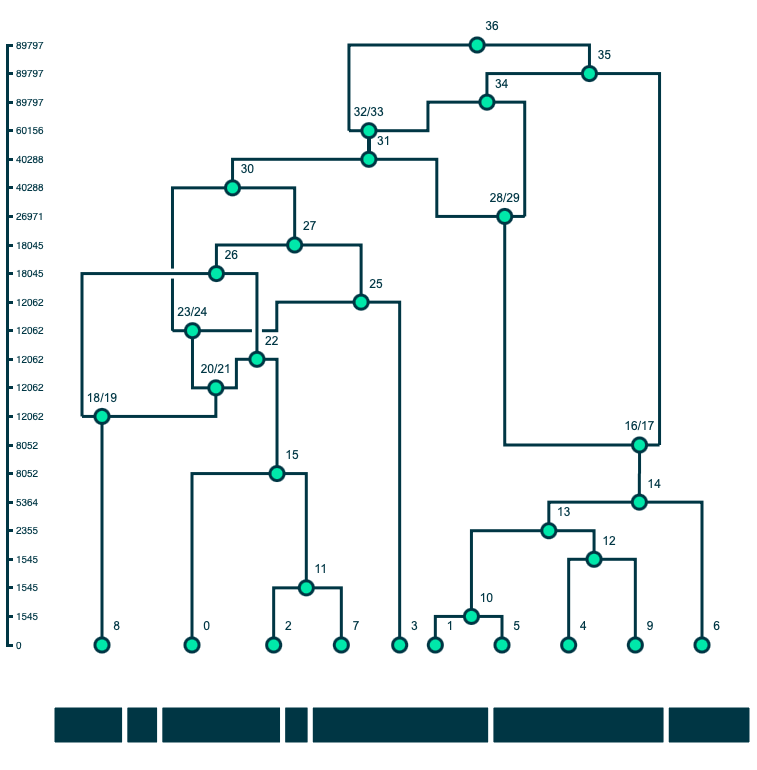
A method for drawing ancestral recombination graphs from tskit tree sequences in Python using D3.js. ARGs are plotted using a D3's force layout. All nodes have a fixed position on the y-axis set by fy. Sample nodes have a fixed position on the x-axis set by fx; the ordering of the sample nodes comes from the first tree in the tskit tree sequence (this is not always the optimal ordering but is generally a good starting point for plotting). The x positions of other nodes are set by a force simulation where all nodes repel each other countered by a linkage force between connected nodes in the graph.
Users can click and drag the nodes (including the sample) along the x-axis to further clean up the layout of the graph. The simulation does not take into account line crosses, which can often be improved with some fiddling. Once a node has been moved by a user, its position is fixed with regards to the force simulation.
Installation
pip install tskit_arg_visualizer
This package loads D3.js using a CDN, so requires access to the internet.
Quickstart
import msprime
import random
import tskit_arg_visualizer

# Generate a random tree sequence with record_full_arg=True so that you get marked recombination nodes
ts_rs = random.randint(0,10000)
ts = msprime.sim_ancestry(
    samples=3,
    recombination_rate=1e-8,
    sequence_length=3_000,
    population_size=10_000,
    record_full_arg=True,
    random_seed=ts_rs
)

d3arg = tskit_arg_visualizer.D3ARG.from_ts(ts=ts)
d3arg.draw(
    width=750,
    height=750,
    edge_type="ortho"
)
The above code can be run in three ways: terminal, Jupyter Notebook, or JupyterLab. For Jupyter Notebook and JupyterLab, you will need to add the following code block to the top of the document to properly load D3.js.
Jupyter Notebook -
%%javascript
require.config({
    paths: {
    d3: 'https://d3js.org/d3.v7.min'
}});

require(["d3"], function(d3) {
    window.d3 = d3;
});
JupyterLab -
%%javascript
var script = document.createElement('script');
script.type = 'text/javascript';
script.src = 'https://d3js.org/d3.v7.min.js';
document.head.appendChild(script);
Drawing Parameters
The draw() function for a D3ARG object has multiple parameters that give users a small amount of customization with their figures:
def draw(
    self,
    width=500,
    height=500,
    tree_highlighting=True,
    y_axis_labels=True,
    y_axis_scale="rank",
    edge_type="line",
    variable_edge_width=False,
    subset_nodes=None,
    include_node_labels=True,
    sample_order=[]
):
"""Draws the D3ARG using D3.js by sending a custom JSON object to visualizer.js

Parameters
----------
width : int
    Width of the force layout graph plot in pixels (default=500)
height : int
    Height of the force layout graph plot in pixels (default=500)
tree_highlighting : bool
    Include the interactive chromosome at the bottom of the figure to
    to let users highlight trees in the ARG (default=True)
y_axis_labels : bool
    Includes labelled y-axis on the left of the figure (default=True)
y_axis_scale : string
    Scale used for the positioning nodes along the y-axis. Options:
        "rank" (default) - equal vertical spacing between nodes
        "time" - vertical spacing is proportional to the time
        "log_time" - proportional to the log of time
edge_type : string
    Pathing type for edges between nodes. Options:
        "line" (default) - simple straight lines between the nodes
        "ortho" - custom pathing (see pathing.md for more details, should only be used with full ARGs)
variable_edge_width : bool
    Scales the stroke width of edges in the visualization will be proportional to the fraction of
    sequence in which that edge is found. (default=False)
subset_nodes : list (EXPERIMENTAL)
    List of nodes that user wants to stand out within the ARG. These nodes and the edges between them
    will have full opacity; other nodes will be faint (default=None, parameter is ignored and all
    nodes will have opacity)
include_node_labels : bool
    Includes the node labels for each node in the ARG (default=True)
sample_order : list
    Sample nodes IDs in desired order. Must only include sample nodes IDs, but does not
    need to include all sample nodes IDs. (default=[], order is set by first tree in tree sequence)
"""
A quick note about line_type="ortho" (more details can be found within pathing.md) - this parameter identifies node types based on msprime flags and applies pathing rules following those types. Because of this, "ortho" should only be used for full ARGs with proper msprime flags and where nodes have a maximum of two parents or children. Other tree sequences, including simplified tree sequences (those without marked recombination nodes marked) should use the "line" edge_type.
Saving Figures
Each figure is actually just a JSON object that D3.js interprets and plots to the screen (see plotting.md for more information about this object). The "Copy Source To Clipboard" button to the top left of each figure copies that specific figure's JSON object to your computer's clipboard. This object includes all of the information needed to replicate the figure in a subsequent simulation and can be pasted into a .json file for later. To revisualize this figure:
import json
import tskit_arg_visualizer

arg_json = json.load(open("example.json", "r"))
tskit_arg_visualizer.draw_D3(arg_json=arg_json)
Alternatively, you can pass the JSON into a D3ARG object constructor, which then gives you access to all of the D3ARG object methods, such as drawing and modifying node labels.
d3arg = tskit_arg_visualizer.D3ARG.from_json(json=arg_json)
d3arg.draw()
Modifying Node Labels
d3arg.set_node_labels(labels={0:"James",6:""})
Node labels can be changed using the set_node_labels() function. The example above will change the labels of Nodes 0 and 6 to "James" and "", respectively. An empty string is equivalent to removing the label of that specific node. Labels are always converted to strings. You can then redraw d3arg with the updated labels. If you wish to go back to the default labelling scheme, you run:
d3arg.reset_node_labels()
Reheating A Figure (EXPERIMENTAL)
The energy of the force layout simulation reduces overtime, causing the nodes to lose speed and settle into positions. Additionally, anytime the user moves a node by dragging, its new position becomes fixed and there on out unchanged by the simulation. The "Reheat Simulation" button in the top left of each figure unfixes the positions of all nodes except for the sample nodes at the tips, and gives a burst of energy to the simulation to allow the nodes to find new optimal positions. This feature is most useful when the starting sample node positions are not optimal; the user can rearrange them and then reheat the simulation to see if that helps with untangling.
Release history Release notifications | RSS feed

Download files
Download the file for your platform. If you're not sure which to choose, learn more about installing packages.
Source Distribution
Built Distribution
Hashes for tskit_arg_visualizer-0.0.1.tar.gz
| Algorithm | Hash digest | |
|---|---|---|
| SHA256 | 10d2965ed20eb9bf8fa22bb51f490d138352c53b4b8f89010426192a76cd8ded |
|
| MD5 | 3e82675d2034e1e343cad89c00491a21 |
|
| BLAKE2b-256 | e4a28129dfa55e21a9dfddd014649494abdeecefe2a5cfda0434437908743c00 |
Hashes for tskit_arg_visualizer-0.0.1-py3-none-any.whl
| Algorithm | Hash digest | |
|---|---|---|
| SHA256 | 054e3dac771688d75986b1cebb2ca5ea4fea288af0c21274c5c5aae44211f3ec |
|
| MD5 | dbf2aeb149560a3dd4687a2f88d24d07 |
|
| BLAKE2b-256 | f757f9ef92bc9c95969d99fc5217db861881f4b437522bb1eb2d5632b31cb89f |


