Finding valeriepieris circles

Project description
valeriepieris
Find valeriepieris circles. There are the smallest circles containing at least a fraction f of the data. See the paper for much more details on how this works and what you can do with a valeriepieris circle.
The code expects 2d-numpy arrays from e.g. SEDAC.
Basic use
import numpy as np
input_data = np.loadtxt("gpw_v4_population_count_rev11_2020_1_deg.asc", skiprows=6 )
input_data[ input_data < 0] = 0
Then call
from valeriepieris import valeriepieris
data_bounds = [ -90,90, -180,180 ] ##[lowest lat, highest lat, lowest lon, highest lon]
target_fracs = [0.25, 0.5, 1]
rmin, smin, best_latlon, data, new_bounds  = valeriepieris(input_data,  data_bounds, target_fracs)
This computes the centre and radius for all the target fractions
for i,f in enumerate(target_fracs):
	print("At f={}, radius={}, population={}, centre={}".format( f, rmin[i], smin[i], best_latlon[i] ) )
gives
At f=0.25, radius=1880.446017450536, population=1997830287.9875035, centre=[(25.5, 88.5)]
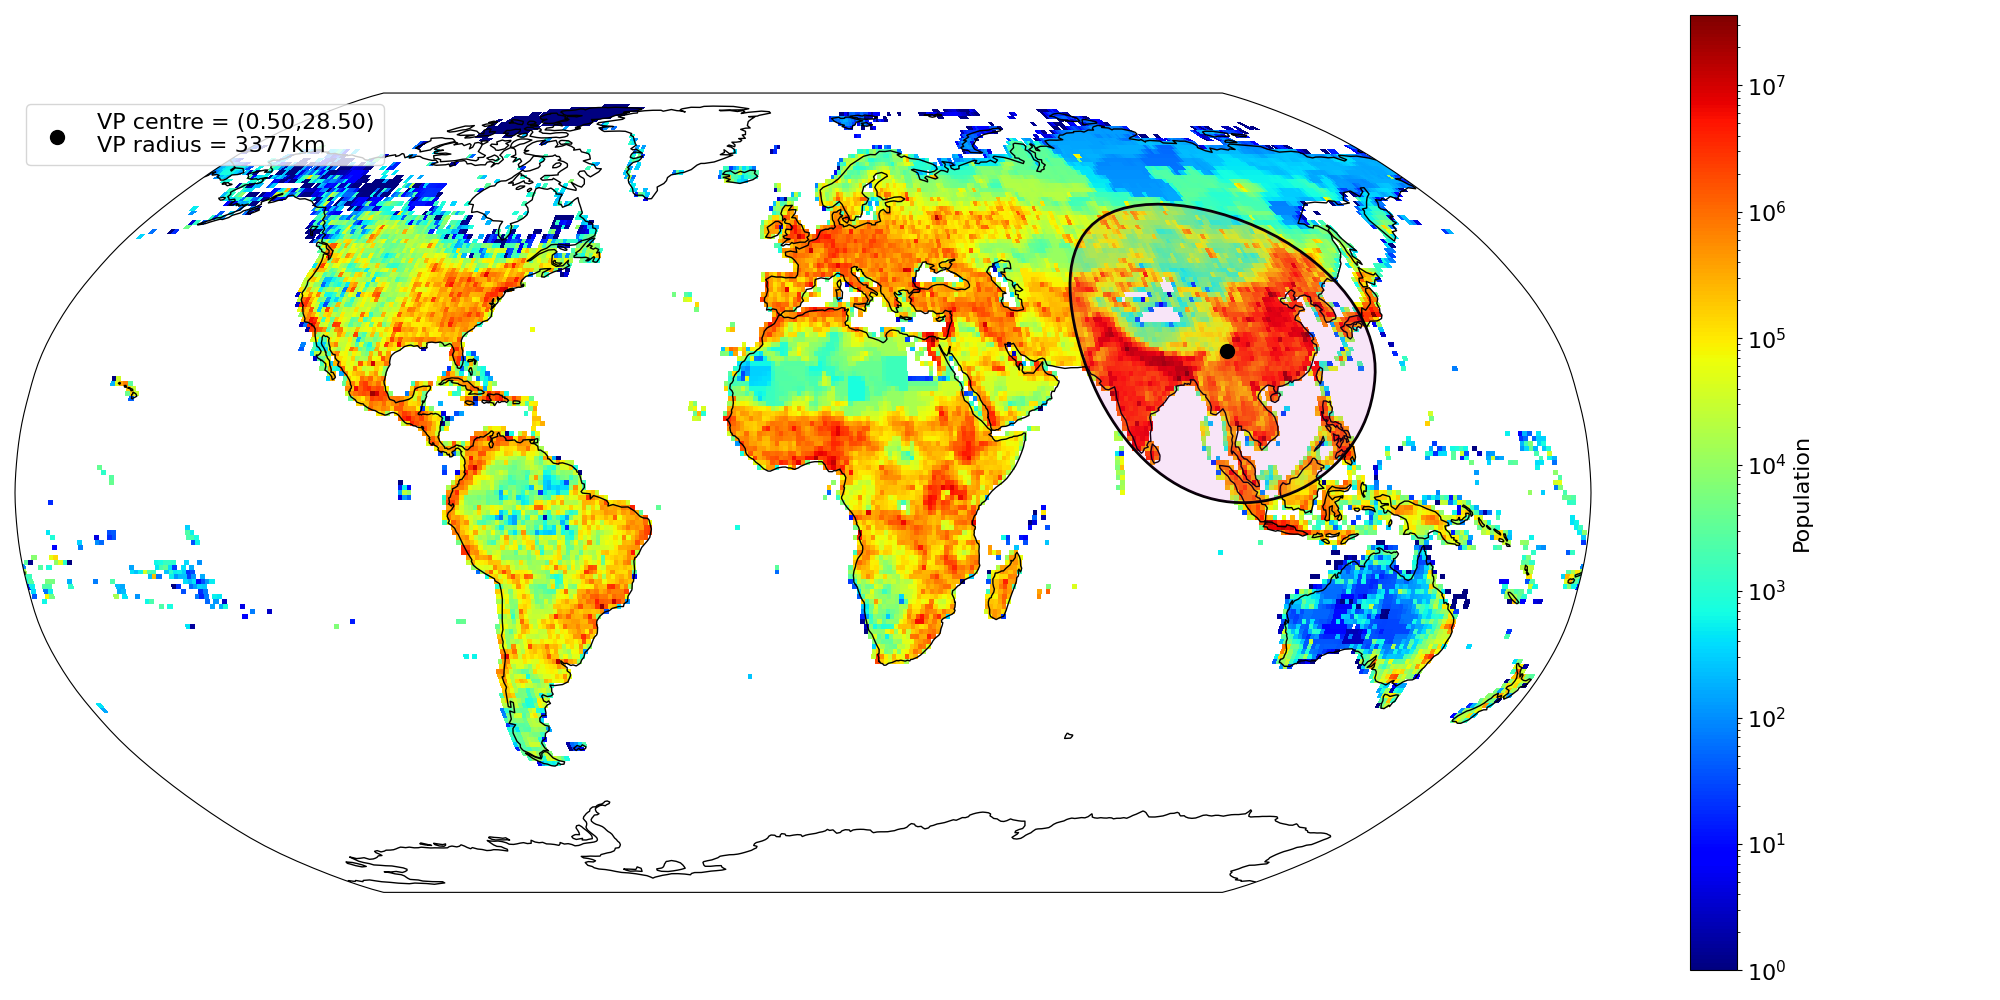
At f=0.5, radius=3376.532684670633, population=3985134876.8947124, centre=[(28.5, 100.5)]
At f=1, radius=14979.863821630814, population=7969444594.980903, centre=[(75.5, -112.5)]
note that each centre is a list, usually of one element, but for very small f there can be multiple centres.
Focussing on a specific area
europe_bounds = [ 34.1,80, -25,34.9 ]
target_fracs = [0.5]
rmin, smin, best_latlon, europe_data, europe_data_bounds  = valeriepieris(input_data,  data_bounds, 0.5, target_bounds=europe_bounds)

for i,f in enumerate(target_fracs):
  print("At f={}, radius={}, population={}, centre={}".format( f, rmin[i], smin[i], best_latlon[i] ) )
print("data in ", europe_data_bounds, "has shape", europe_data.shape)
At f=0.5, radius=946.0320718882176, population=371822374.10794944, centre=[(49.5, 9.5)]
data in  [34.1, 80, -25, 34.9] has shape (47, 61)
If the target_bounds argument is given, only data within that area will be considered. The data that was used in the calculation and its boundary (snapped to the input grid) is returned.
Focussing the search
If you think you know where the centre is, or you want the smallest circle containing a fraction f of the data, centered within a certain area do the following
data_bounds = [ -90,90, -180,180 ] ##[lowest lat, highest lat, lowest lon, highest lon]
target_fracs = [0.5]
search_bounds = [ 24,50, -125, -66 ] #~continental US
rmin, smin, best_latlon, data, new_bounds  = valeriepieris(input_data,  data_bounds, target_fracs, search_bounds=search_bounds)

for i,f in enumerate(target_fracs):
	print("At f={}, radius={}, population={}, centre={}".format( f, rmin[i], smin[i], best_latlon[i] ) )
At f=0.5, radius=10344.885492078058, population=3987443544.209256, centre=[(50.5, -66.5)]
Plotting the circles
Remember the earth is round, so don't just draw a circle on a flat map! See test.py for code to make the plot at the top


Download files
Download the file for your platform. If you're not sure which to choose, learn more about installing packages.
Source Distribution
Built Distribution
Hashes for valeriepieris-0.1.4-cp38-cp38-manylinux_2_17_x86_64.manylinux2014_x86_64.whl
| Algorithm | Hash digest | |
|---|---|---|
| SHA256 | 47c825a20c71e137025f337d087289d14015f311dc3345041b95012ddc8fe05d |
|
| MD5 | 37b84255d14bf0e68a3ef092760dc3a7 |
|
| BLAKE2b-256 | 5eda7953f19c68f8410732d5f3f7572d98f66643d819cde31939e1a45b449482 |


