World Bank Data API in Python

Project description
The World Bank Data in Python
This is an implementation of the World Bank API v2 in Python.
Install
Install or update the World Bank Data python package with
pip install world_bank_data --upgrade
Quick tutorial
Get the list of sources, topics, countries, regions
import pandas as pd
import world_bank_data as wb
pd.set_option('display.max_rows', 6)
The list of topics is available with
wb.get_topics()
Sources are returned by
wb.get_sources()
And finally, the list of countries is accessible with
wb.get_countries()
In addition, give a try to
get_regionsget_incomelevelsget_lendingtypes
to see how the World countries are classified.
Get the list of available indicators
This is done with the get_indicators function. You may query only the indicators for a specific source or topic: use the index for that source or topic from get_source and get_topic. If you input no arguments, the get_indicator function will return the description of all the 16,000 indicators.
wb.get_indicators(topic=3, source=2)
Searching for one country or indicator
Use the functions search_countries, search_source, search_indicators, or simply call search on your existing dataframe.
wb.search_indicators('mathematics')
Get indicator value
The function get_series will return the value of a single indicator. The World Bank API accepts quite a few arguments, including:
mrv, integer: one or more most recent valuesdate, string: either one year, or two years separated with a colon, like '2010:2018'gapfill, string: 'Y' or 'N' (the default): forward fills missing values.
wb.get_series('SP.POP.TOTL', mrv=1)
By default, the get_series function returns the full index given by the World bank, even if there is a single series and a single year. Use the argument simplify_index to ignore these dimensions. Also, use the argument id_or_value='id' if you prefer your data to be indexed by the codes rather than labels.
wb.get_series('SP.POP.TOTL', date='2016', id_or_value='id', simplify_index=True)
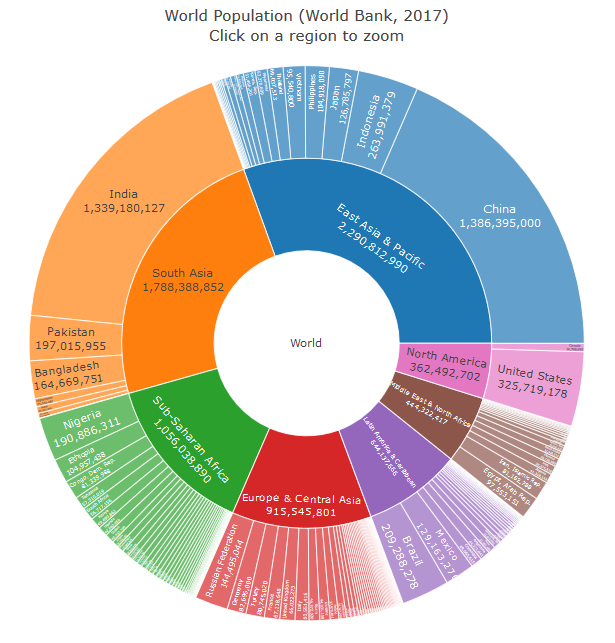
Ready for an interative tutorial?
Go to our Binder and run either this README, or our other [tutorial] on how to produce this plot of the World Population:
References
The World Bank
This package eases the access to the World Bank Data. You can also explore the Data Catalog, and the data itself directly on the site.
Third party applications that allow to access the data from various languages are listed here.
Google's Public Data Explorer
The World Bank data can be visualized in Google's Data Explorer.
R
R users can use two packages to access the World Bank data:
See here for an Introduction to the wbstats R-package. For a quick comparison of the two packages, see here.
Python
Python users can also use, alternatively to world_bank_data, the following two packages:
The reason for which I wrote world_bank_data is mostly speed, e.g. I wanted to use the lastest version of the World Bank API (v2) and benefit from significant speed improvements. Reimplementing the API also gave me a finer control on the mapping of options.
FAQ
Using another language
The World Bank describes their sources and indicators in a few other languages than English. Use either the language argument in each function, or change the default globally:
wb.options.language = 'vi'
wb.get_indicators('SP.POP.TOTL')
wb.options.language = 'en'
Caching
All requests, except get_series, are cached using a least recently used cache from the cachetools package.
License
This python package is licenced under the MIT License.
Please also read the World Bank Terms of Use relative to the conditions that apply to the data downloaded with this package.


Download files
Download the file for your platform. If you're not sure which to choose, learn more about installing packages.


