Pandas Magic for Excel spreadsheets

Project description
# XLLink for Pandas
API docs: https://0hughman0.github.io/xl_link/api.html
Installation: `pip install xl_link`
Love the functionality of Pandas, but find yourself disappointed that as soon as your DataFrame is written to excel, you loose it all?
Fear not! XLLink solves this by returning the powerfull XLMap object upon use of to_excel!
This xlmap supports all your favourite indexing methods, i.e. loc, iloc, at and iat, but instead of returning a DataFrame, Series, or scalar, XLMap will instead return the XLRange, or XLCell corresponding to the location of the result within your spreadsheet.
Perhaps more usefully, xlmaps offer a wrapper around excel engines (currently supporting xlsxwriter and openpyxl) to make creating charts in excel far more intuitive.
## Chart capabilities
Here’s a teaser of what xl_link can do when combined with xlsx writer (for example):
>>> writer = pd.ExcelWriter("Example.xlsx", engine='xlsxwriter')
>>> f1 = XLDataFrame(columns=('X', 'Y1', 'Y2'),
data={'X': range(10),
'Y1': list(random.randrange(0, 10) for _ in range(10)),
'Y2': list(random.randrange(0, 10) for _ in range(10))})
>>> f1.set_index('X', inplace=True)
>>>
>>> xlmap1 = f1.to_excel(writer, sheet_name='scatter')
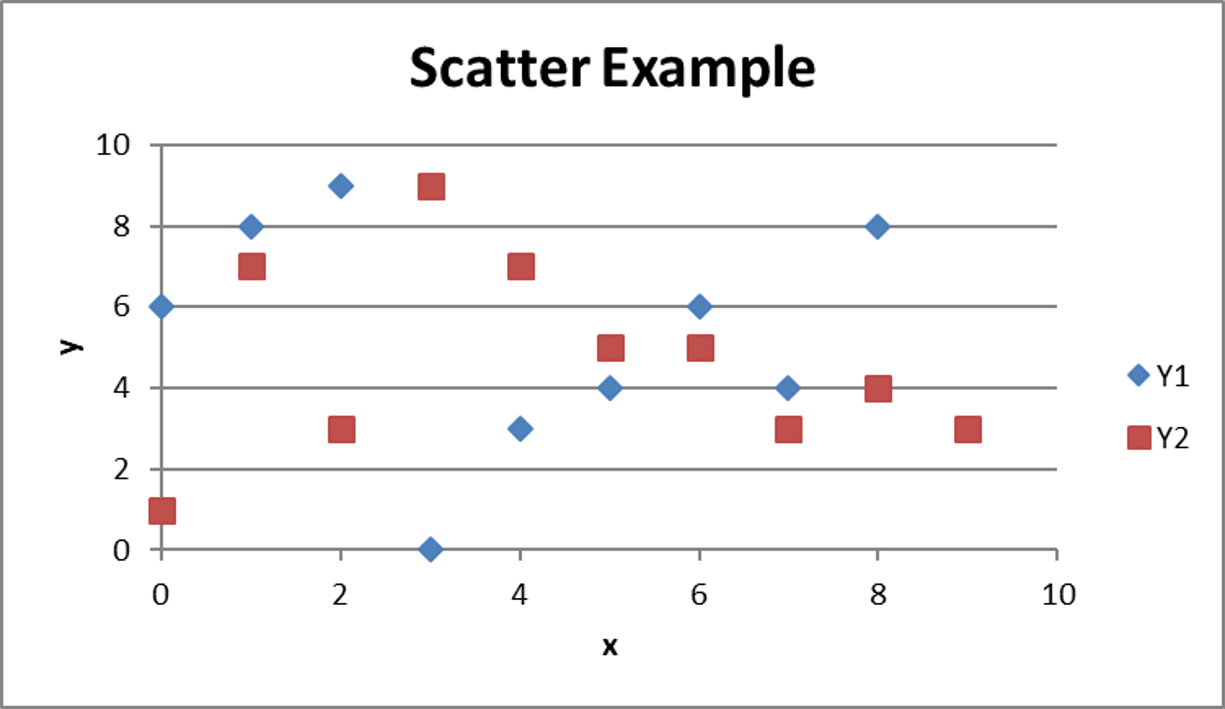
>>> scatter_chart = xlmap1.create_chart('scatter', x_axis_name='x', y_axis_name='y', title='Scatter Example')
>>> xlmap1.sheet.insert_chart(xlmap1.columns[-1].translate(0, 1).cell, scatter_chart) # Puts at top of first empty col
>>> writer.save()
Which produces this chart:
Creating a complex chart like this:
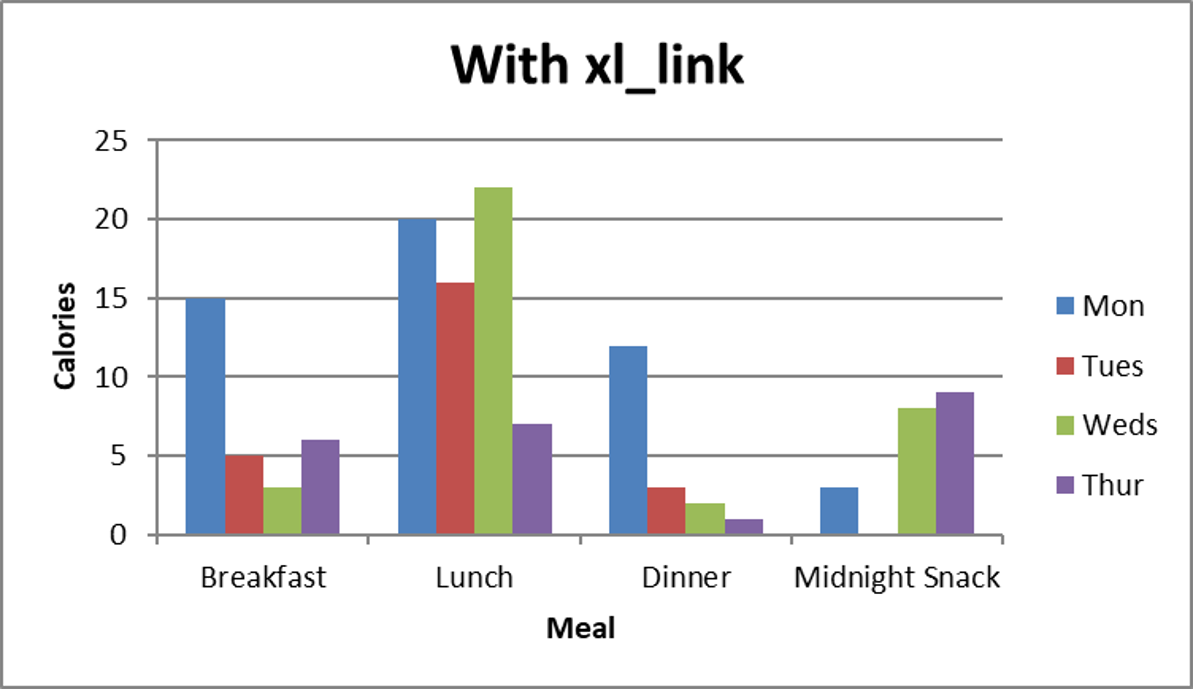
is as easy as:
Setup
>>> writer = pd.ExcelWriter("Comparison.xlsx", engine='xlsxwriter')
>>> calories_per_meal = XLDataFrame(columns=("Mon", "Tues", "Weds", "Thur"),
                                   index=('Breakfast', 'Lunch', 'Dinner', 'Midnight Snack'),
                                   data={'Mon': (15, 20, 12, 3),
                                         'Tues': (5, 16, 3, 0),
                                         'Weds': (3, 22, 2, 8),
                                         'Thur': (6, 7, 1, 9)})
Create chart with xl_link
>>> xlmap = calories_per_meal.to_excel(writer, sheet_name="XLLinked")
>>> xl_linked_chart = xlmap.create_chart('column', title="With xl_link", x_axis_name="Meal", y_axis_name="Calories")
>>> xlmap.sheet.insert_chart('A1', xl_linked_chart)
>>> xlmap.writer.save()
Creating the same chart without xl_link looks something like:
>>> calories_per_meal.to_excel(writer, sheet_name="Without")
>>> without_sheet = writer.sheets["Without"]
>>> without_chart = writer.book.add_chart({"type": "column"})
>>> for col_num in range(1, len(calories_per_meal.index) + 1):
>>>     without_chart.add_series({'name': ["Without", col_num, 0],
>>>                               'categories': ["Without", 0, 1, 0, 4],
>>>                               'values': ["Without", col_num, 1, col_num, 4]})
>>> without_chart.set_x_axis({'name': 'Meal'})
>>> without_chart.set_y_axis({'name': 'Calories'})
>>> without_chart.title = "Without xl_link"
>>> without_sheet.insert_chart('A1', without_chart)
>>> writer.save()
With xl_link’s sensible defaults, it’s easy to create complex charts.
xl_link passes the chart type, and subtype straight to the excel engine, so if it’s in the engine’s docs, it should work!
### Indexing capabilities
An XLMap object represents a DataFrame, frozen as it was written to excel, but crucially, it knows the location of every cell and index of f within the spreadsheet.
Let’s look at XLMap with a more detailed example:
>>> f = XLDataFrame(columns=("Mon", "Tues", "Weds", "Thur"),
                     index=('Breakfast', 'Lunch', 'Dinner', 'Midnight Snack'),
                     data={'Mon': (15, 20, 12, 3),
                           'Tues': (5, 16, 3, 0),
                           'Weds': (3, 22, 2, 8),
                           'Thur': (6, 7, 1, 9)})
>>> f
                        Mon                  Tues      Weds       Thur
    Breakfast         Toast                 Bagel    Cereal  Croissant
    Lunch              Soup  Something Different!      Rice     Hotpot
    Dinner            Curry                  Stew     Pasta    Gnocchi
    Midnight Snack  Shmores               Cookies  Biscuits  Chocolate
>>> xlmap = f.to_excel("t.xlsx") >>> xlmap <XLMap: index: <XLRange: 'Sheet1'!A2:A5>, columns: <XLRange: 'Sheet1'!B1:F1>, data: <XLRange: 'Sheet1'!B2:F5>> >>> xlmap.index <XLRange: 'Sheet1'!A2:A5> >>> xlmap.columns <XLRange: 'Sheet1'!B1:E1>
If you were to open t.xlsx you would find that the ranges described by xlmap line up perfectly with where f was written. And, write_frame is smart, you can use all of the parameters you normally use with DataFrame.to_excel, just pass them as a dict to write_frame:
>>> xlmap = xl_link.write_frame(f, "t.xlsx", {'sheet_name': 'Demo Sheet', 'startrow': 7})
>>> xlmap
    <XLMap: index: <XLRange: 'Demo Sheet'!A9:A12>, columns: <XLRange: 'Demo Sheet'!B8:E8>, data: <XLRange: 'Demo Sheet'!B9:E12>>
Here are some more indexing examples:
>>> # loc
>>> xlmap.loc['Lunch', 'Thur']
    <XLCell: 'Demo Sheet'!E10>
>>> xlmap.loc['Dinner', :]
    <XLRange: 'Demo Sheet'!B11:E11>
>>> # iloc
>>> xlmap.iloc[3, 2]
    <XLCell: 'Demo Sheet'!D12>
>>> xlmap.iloc[:, 1]
    <XLRange: 'Demo Sheet'!C9:C12>
>>> # at
>>> xlmap.at['Midnight Snack', 'Tues']
    <XLCell: 'Demo Sheet'!C12>
>>> # iat
>>> xlmap.iat[0, 2]
    <XLCell: 'Demo Sheet'!D9>
>>> # __getitem__
>>> xlmap['Mon']
    <XLCell: 'Demo Sheet'!B8>
>>> xlmap[['Mon', 'Tues', 'Weds']]
    <XLRange: 'Demo Sheet'!B2:D5>
For convenience, you can access a copy of the frame f, in it’s state as it was written to excel:
>>> f.loc['Lunch'] = "Nom Nom Nom"
>>> f
                            Mon         Tues         Weds         Thur
    Breakfast             Toast        Bagel       Cereal    Croissant
    Lunch           Nom Nom Nom  Nom Nom Nom  Nom Nom Nom  Nom Nom Nom
    Dinner                Curry         Stew        Pasta      Gnocchi
    Midnight Snack      Shmores      Cookies     Biscuits    Chocolate
>>> xlmap.f # Preserved :) Mon Tues Weds Thur Breakfast Toast Bagel Cereal Croissant Lunch Soup Something Different! Rice Hotpot Dinner Curry Stew Pasta Gnocchi Midnight Snack Shmores Cookies Biscuits Chocolate
## XLRange and XLCell
These are the objects used within xl_link to represent ranges and cells within excel.
These objects have a ton of methods, making them powerful in themselves, if needs be, you can create them yourself:
>>> from xl_link.xl_types import XLRange, XLCell
>>> start = XLCell(1, 1) # using row, col
>>> stop = XLCell(1, 8)
>>> between = start - stop
    <XLRange: 'Sheet1'!B2:I2>
and you can get their location in excel notation via XLCell.cell and XLRange.range respectively:
>>> start
    <XLCell: 'Sheet1'!B2>
>>> start.cell
    'B2'
>>> stop
    <XLCell: 'Sheet1'!I2>
>>> between
    <XLRange: 'Sheet1'!B2:I2>
>>> between.range
    'B2:I2'
For convenience add the f prefix for a formula compatible version:
>>> start.fcell
    "'Sheet1'!B2"
>>> between.frange
    "'Sheet1'!B2:I2"
And if you prefer to use this notation to initalise you XLRanges and XLCells, that’s find too, using from_cell, from_fcell, from_range and from_frange:
>>> XLCell.from_cell("A6")
    <XLCell: 'Sheet1'!A6>
>>> XLRange.from_frange("'Another Sheet'!D2:R2")
    <XLRange: ''Another Sheet''!D2:R2>
Translate them, get items using a range of indexers, and even iterate over 1D XLRanges:
>>> new_start = start.translate(0, 2)
>>> new_stop = stop.translate(0, 2)
>>> new_between = new_start - new_stop
>>> new_between
    <XLRange: 'Sheet1'!D2:K2>
>>> new_between[3:]
    <XLRange: 'Sheet1'!G2:K2>
>>> for cell in new_between:
        print(cell.cell)
    D2
    E2
    F2
    G2
    H2
    I2
    J2
    K2
This package uses the utility functions from XlsxWriter under the BSD license found here: https://github.com/jmcnamara/XlsxWriter
Copyright (c) 2016 0Hughman0
Permission is hereby granted, free of charge, to any person obtaining a copy of this software and associated documentation files (the “Software”), to deal in the Software without restriction, including without limitation the rights to use, copy, modify, merge, publish, distribute, sublicense, and/or sell copies of the Software, and to permit persons to whom the Software is furnished to do so, subject to the following conditions:
The above copyright notice and this permission notice shall be included in all copies or substantial portions of the Software.
THE SOFTWARE IS PROVIDED “AS IS”, WITHOUT WARRANTY OF ANY KIND, EXPRESS OR IMPLIED, INCLUDING BUT NOT LIMITED TO THE WARRANTIES OF MERCHANTABILITY, FITNESS FOR A PARTICULAR PURPOSE AND NONINFRINGEMENT. IN NO EVENT SHALL THE AUTHORS OR COPYRIGHT HOLDERS BE LIABLE FOR ANY CLAIM, DAMAGES OR OTHER LIABILITY, WHETHER IN AN ACTION OF CONTRACT, TORT OR OTHERWISE, ARISING FROM, OUT OF OR IN CONNECTION WITH THE SOFTWARE OR THE USE OR OTHER DEALINGS IN THE SOFTWARE.
Release history Release notifications | RSS feed


Download files
Download the file for your platform. If you're not sure which to choose, learn more about installing packages.


