A tool for drawing ANI clustermap between all-vs-all microbial genomes

Project description
ANIclustermap


Overview
ANIclustermap is easy-to-use tool for drawing ANI(Average Nucleotide Identity) clustermap between all-vs-all microbial genomes. ANI between all-vs-all genomes are calculated by fastANI (or skani) and clustermap is drawn using seaborn.
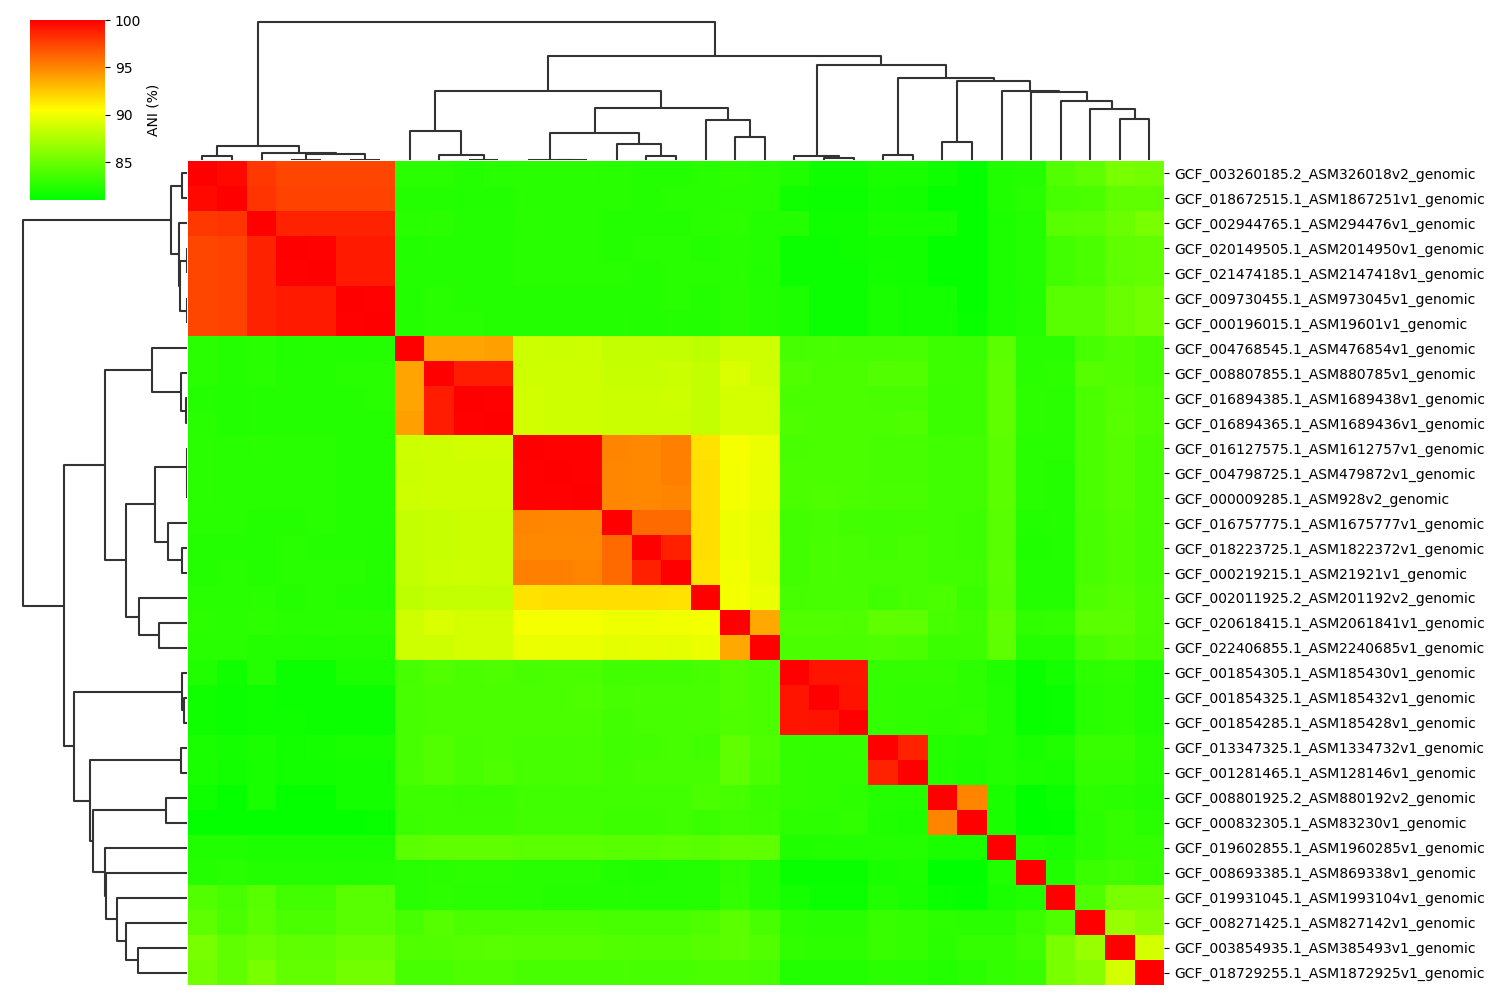
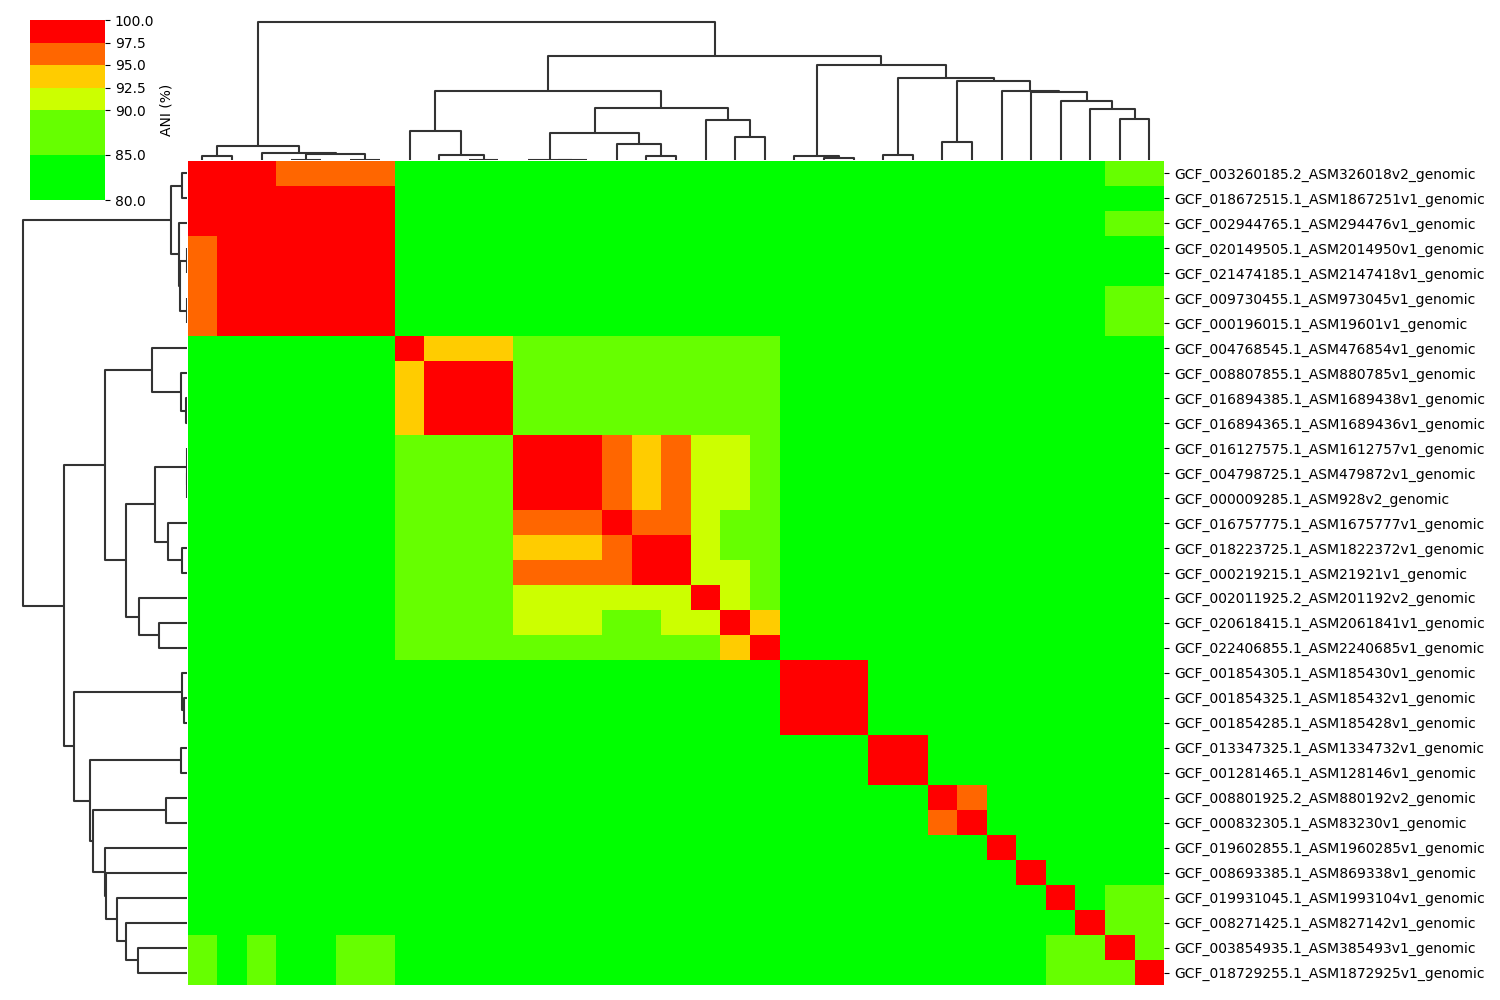
Fig1. ANI clustermap between all-vs-all 33 genomes.

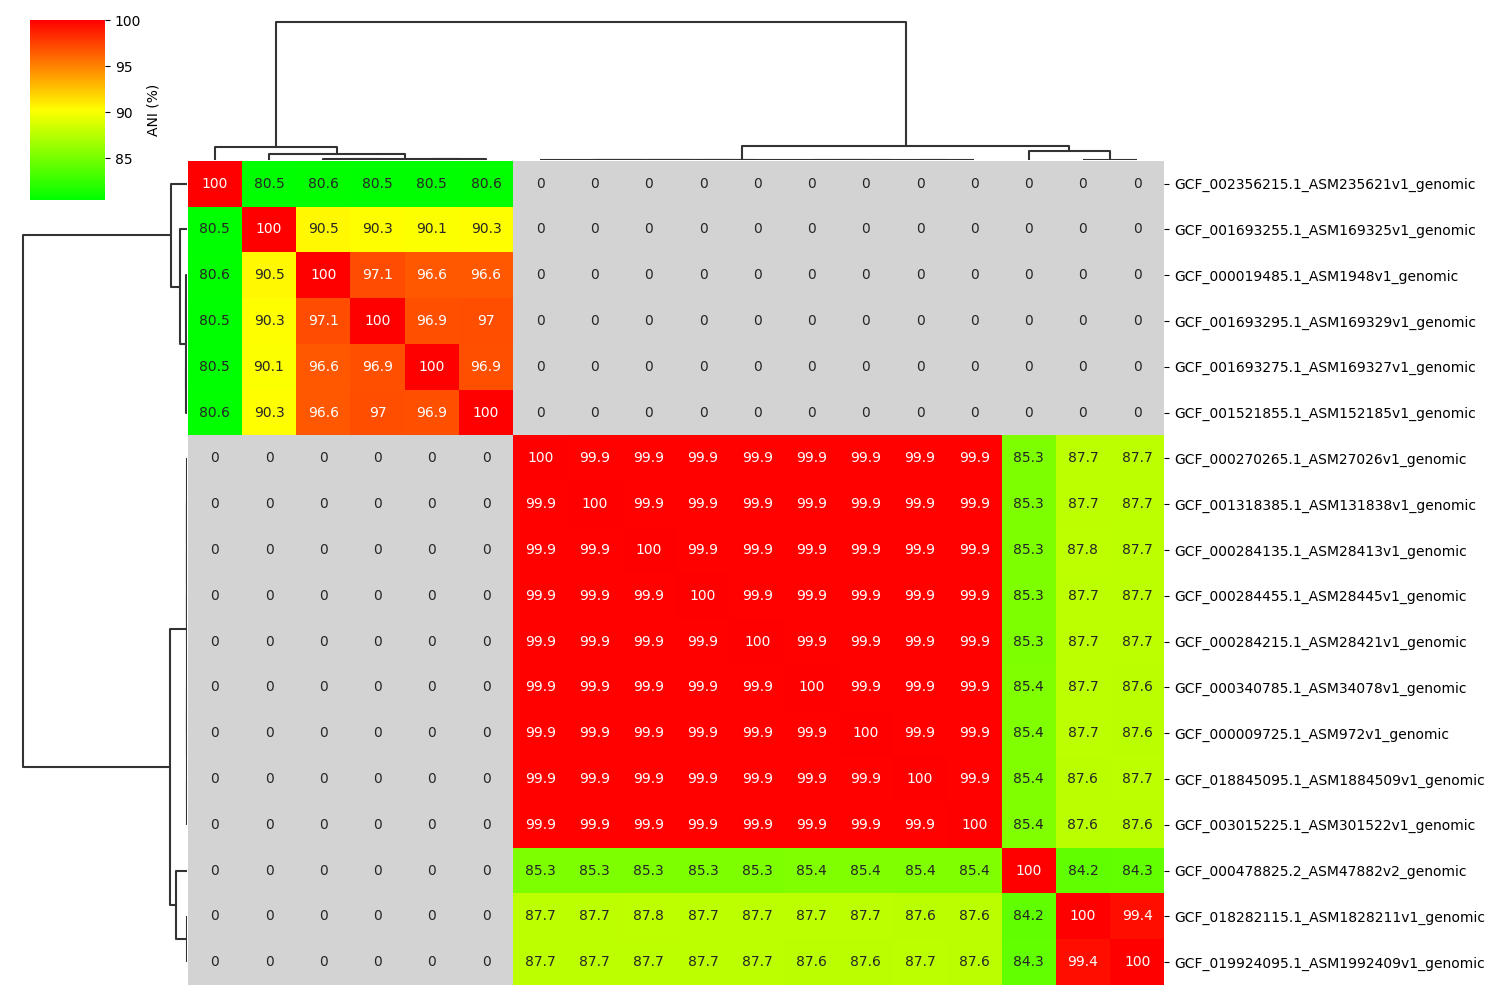
Fig2. ANI clustermap between all-vs-all 18 genomes. If no similarity detected by fastANI, filled in gray.
Installation
Python 3.9 or later is required for installation.
fastANI or skani is required to calculate ANI.
Install bioconda package:
conda install -c conda-forge -c bioconda aniclustermap
Install PyPI stable package:
pip install aniclustermap
Workflow
Description of ANIclustermap's automated workflow.
- Calculate ANI between all-vs-all microbial genomes by fastANI (or skani).
If no similarity detected by fastANI, NA is output. In that case, NA is replaced by 0.0.
If previous result available at the time of re-run, reuse previous result. - Clustering ANI matrix by scipy UPGMA method.
- Using clustered matrix, draw ANI clustermap by seaborn.
Usage
Basic Command
ANIclustermap -i [Genome fasta directory] -o [output directory]
Options
$ ANIclustermap --help

Usage: ANIclustermap [OPTIONS]

Draw ANI(Average Nucleotide Identity) clustermap

╭─ Options ────────────────────────────────────────────────────────────────────────────────────────────╮
│ *  --indir             -i        Input genome fasta directory (*.fa|*.fna[.gz]|*.fasta) [required]   │
│ *  --outdir            -o        Output directory [required]                                         │
│    --mode                        ANI calculation tool (fastani|skani) [default: fastani]             │
│    --thread_num        -t        Thread number parameter [default: MaxThread - 1]                    │
│    --overwrite                   Overwrite previous ANI calculation result                           │
│    --fig_width                   Figure width [default: 10]                                          │
│    --fig_height                  Figure height [default: 10]                                         │
│    --dendrogram_ratio            Dendrogram ratio to figsize [default: 0.15]                         │
│    --cmap_colors                 cmap interpolation colors parameter [default: lime,yellow,red]      │
│    --cmap_gamma                  cmap gamma parameter [default: 1.0]                                 │
│    --cmap_ranges                 Range values (e.g. 80,90,95,100) for discrete cmap                  │
│    --cbar_pos                    Colorbar position [default: 0.02, 0.85, 0.04, 0.15]                 │
│    --annotation                  Show ANI value annotation                                           │
│    --annotation_fmt              Annotation value format [default: .3g]                              │
│    --quiet                       No print log on screen                                              │
│    --version           -v        Print version information                                           │
│    --help              -h        Show this message and exit.                                         │
╰──────────────────────────────────────────────────────────────────────────────────────────────────────╯
Example Command
7 genomes minimal dataset. Click here to download dataset.
ANIclustermap -i ./minimal_dataset/ -o ./ANIclustermap_result
Output Contents
ANIclustermap outputs 3 types of result files.
-
ANIclustermap.[png|svg](example1, example2)
ANI clustermap result figure. -
ANIclustermap_matrix.tsv(example)
Clustered all-vs-all ANI matrix. -
ANIclustermap_dendrogram.nwk(example)
Newick format clustering dendrogram.
Gallery
Example gallery of 33 genomes normal dataset.
If you want to try it for yourself, click here to donwload dataset.
Normal parameter:
ANIclustermap -i ./normal_dataset -o ./ANIclustermap_result01 \
              --fig_width 15
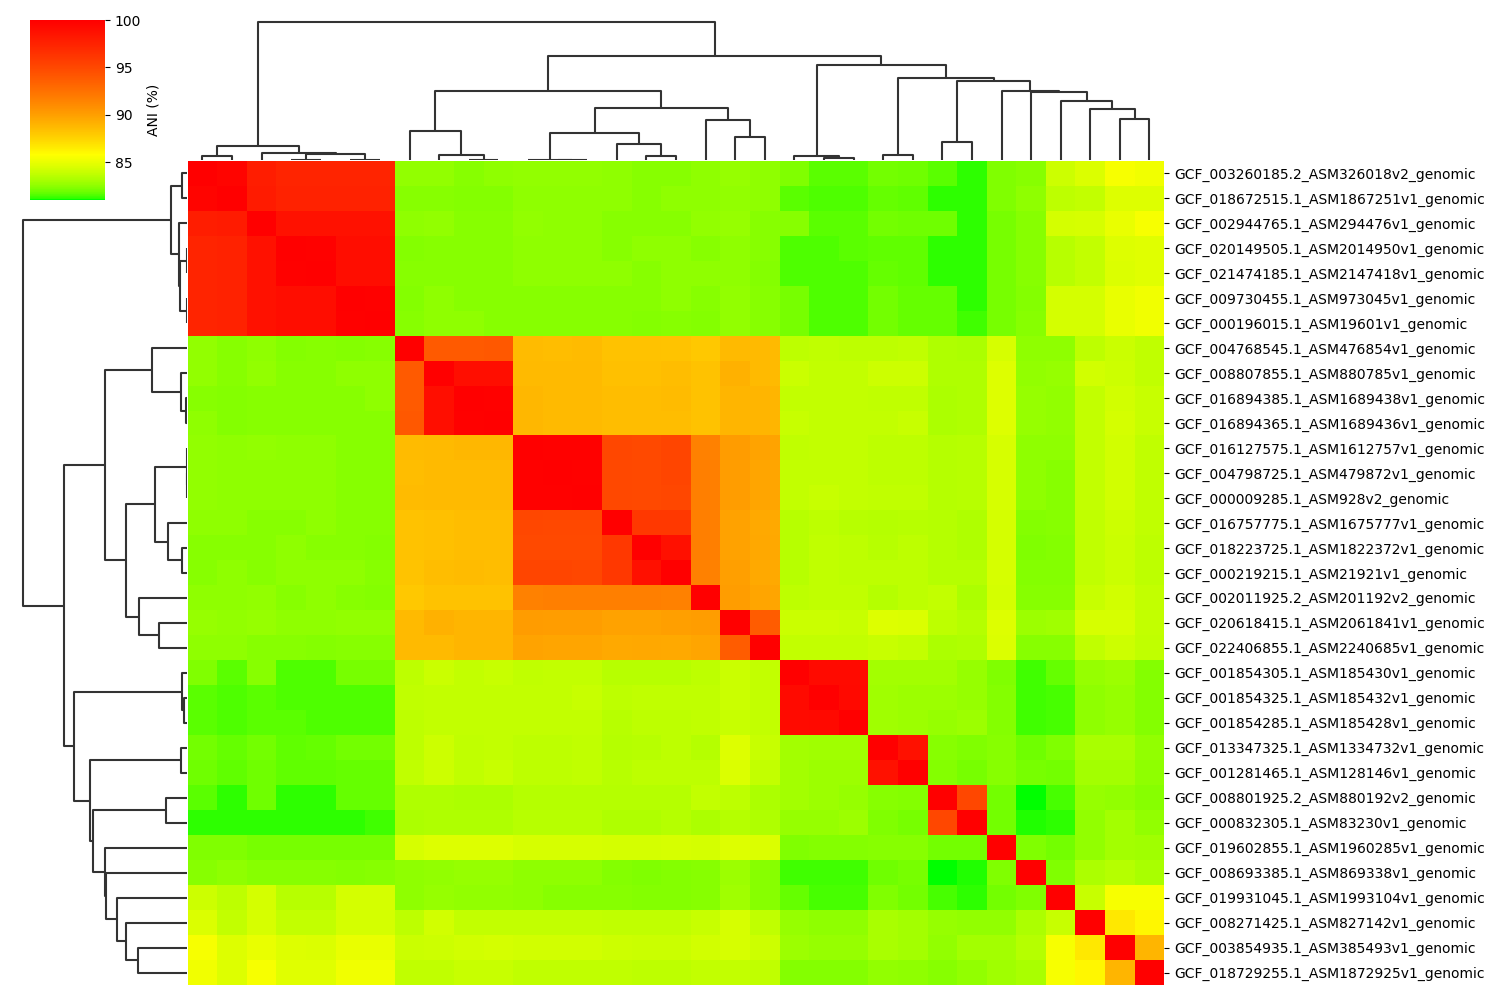
Change cmap_gamma parameter:
ANIclustermap -i ./normal_dataset -o ./ANIclustermap_result02 \
              --fig_width 15 --cmap_gamma 0.5
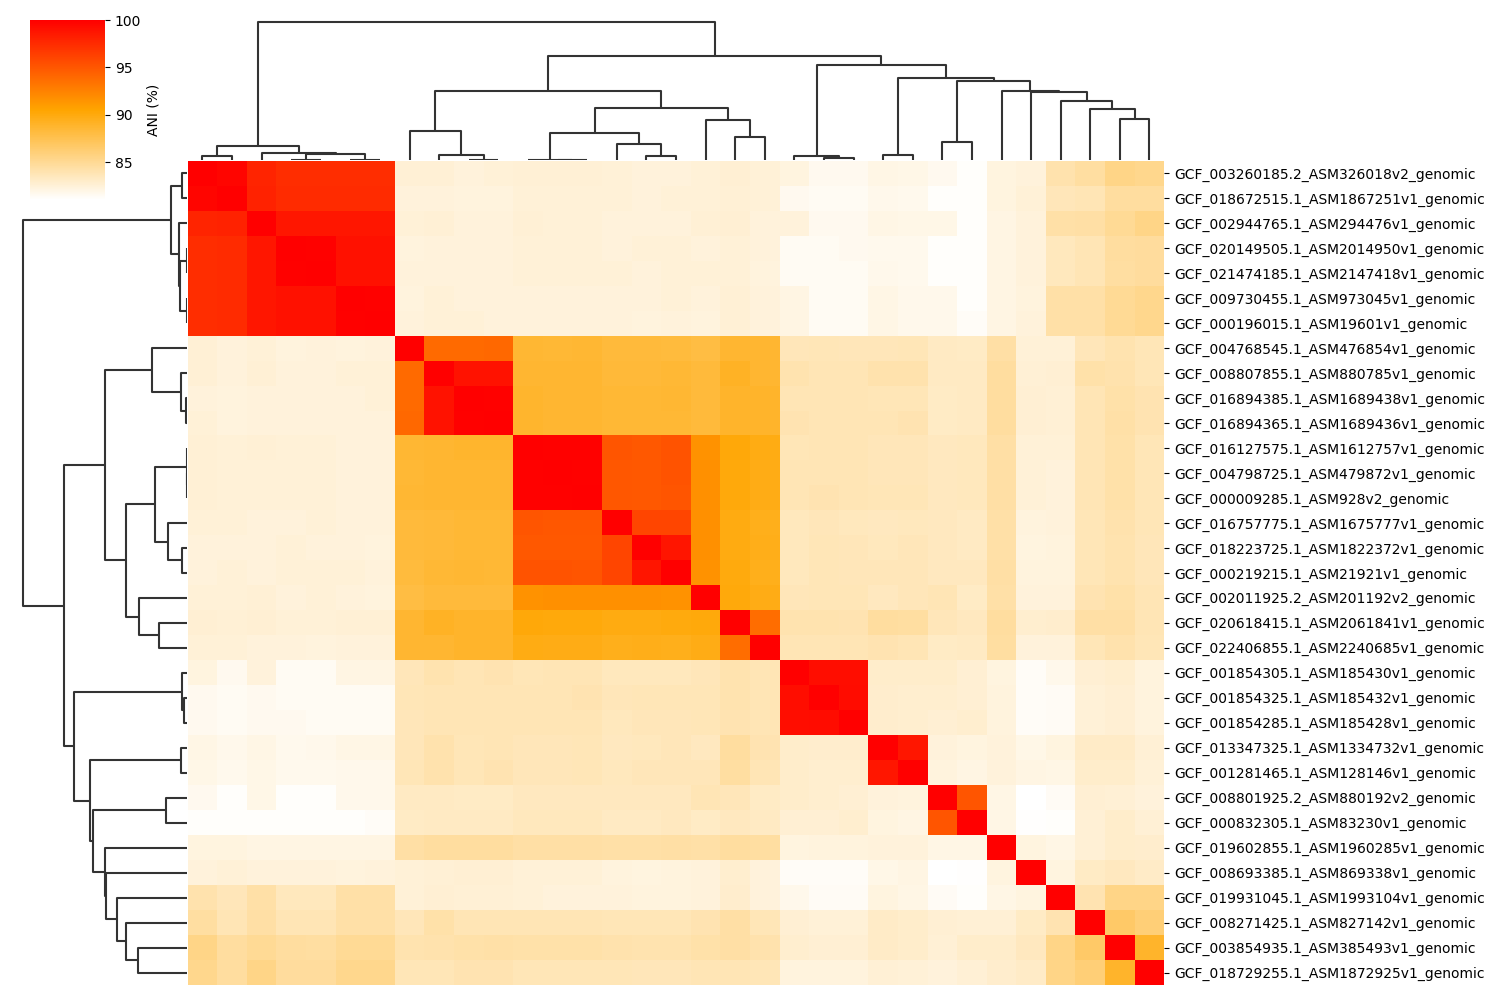
Change cmap_colors(=white,orange,red) paramter:
ANIclustermap -i ./normal_dataset -o ./ANIclustermap_result03 \
              --fig_width 15 --cmap_colors white,orange,red
Change cmap_ranges paramter:
ANIclustermap -i ./normal_dataset -o ./ANIclustermap_result04 \
              --fig_width 15 --cmap_ranges 80,85,90,92.5,95,97.5,100
See this issue for more details.
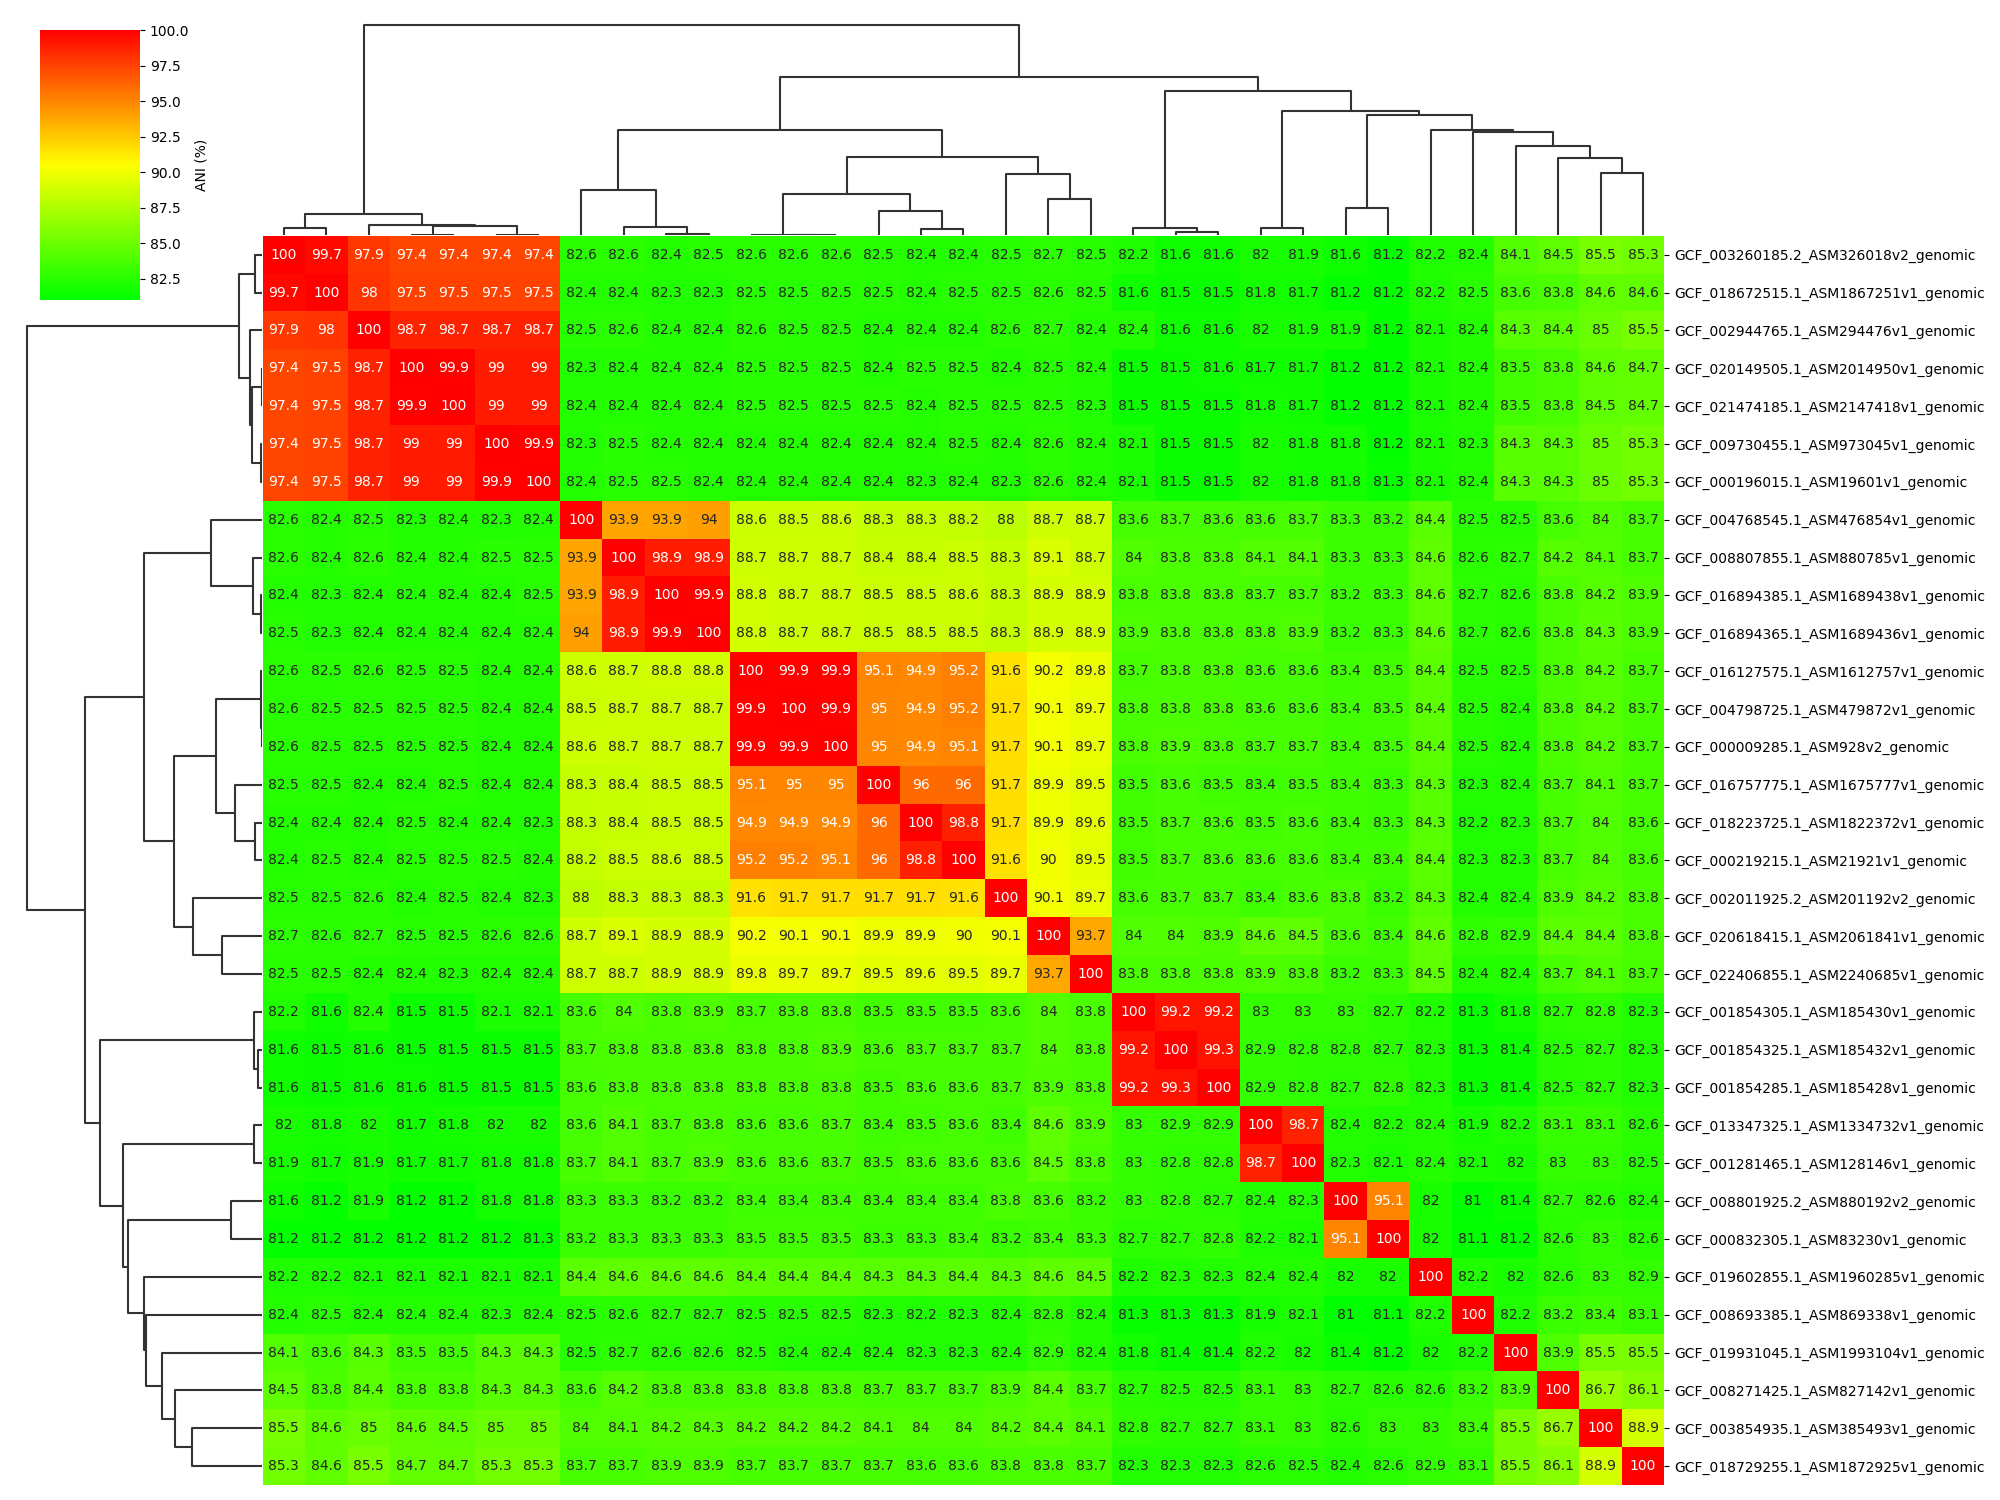
Add ANI value annotation parameter:
ANIclustermap -i ./normal_dataset -o ./ANIclustermap_result05 \
              --fig_width 20 --fig_height 15 --annotation


