A tool to fit data to many distributions and get the best one(s)

Project description


Compatible with Python 3.7, and 3.8, 3.9
What is it ?
The fitter package is a Python library used for fitting probability distributions to data. It provides a straightforward and and intuitive interface to estimate parameters for various types of distributions, both continuous and discrete. Using fitter, you can easily fit a range of distributions to your data and compare their fit, aiding in the selection of the most suitable distribution. The package is designed to be user-friendly and requires minimal setup, making it a useful tool for data scientists and statisticians working with probability distributions.
Installation
pip install fitter
fitter is also available on conda (bioconda channel):
conda install fitter
Usage
standalone
A standalone application (very simple) is also provided and works with input CSV files:
fitter fitdist data.csv --column-number 1 --distributions gamma,normal
It creates a file called fitter.png and a log fitter.log
From Python shell
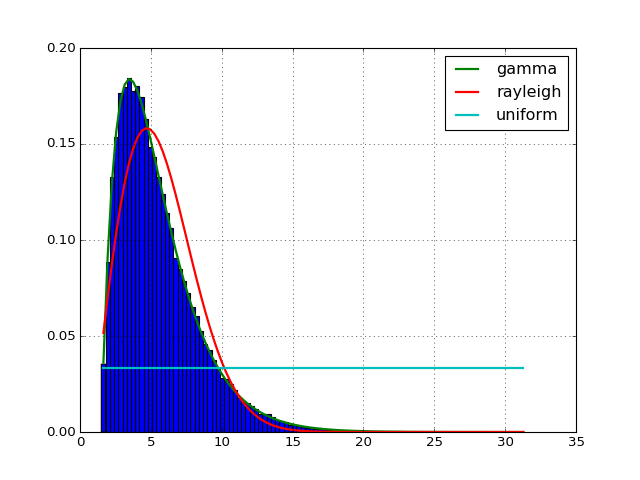
First, let us create a data samples with N = 10,000 points from a gamma distribution:
from scipy import stats
data = stats.gamma.rvs(2, loc=1.5, scale=2, size=10000)
Now, without any knowledge about the distribution or its parameter, what is the distribution that fits the data best ? Scipy has 80 distributions and the Fitter class will scan all of them, call the fit function for you, ignoring those that fail or run forever and finally give you a summary of the best distributions in the sense of sum of the square errors. The best is to give an example:
from fitter import Fitter
f = Fitter(data)
f.fit()
# may take some time since by default, all distributions are tried
# but you call manually provide a smaller set of distributions
f.summary()
See the online documentation for details.
Contributors
Setting up and maintaining Fitter has been possible thanks to users and contributors. Thanks to all:

Changelog
Version |
Description |
|---|---|
1.7.1 |
|
1.7.0 |
|
1.6.0 |
|
1.5.2 |
|
1.5.1 |
|
1.5.0 |
|
1.4.1 |
|
1.4.0 |
|
1.3.0 |
|
1.2.3 |
|
1.2.2 |
was not released |
1.2.1 |
adding new class called histfit (see documentation) |
1.2 |
|
1.1 |
|
1.0.9 |
|
1.0.6 |
|
1.0.5 |
|
1.0.2 |
add manifest to fix missing source in the pypi repository. |


