Gurobi log file tools for parsing and exploring data

Project description
gurobi-logtools


Extract information from Gurobi log files and generate pandas DataFrames or Excel worksheets for further processing. Also includes a wrapper for out-of-the-box interactive visualizations using the plotting library Plotly.
[!NOTE] We have renamed the project to
gurobi-logtools, so please also adapt the import statement accordingly:
import gurobi_logtools as glt
Installation
python -m pip install gurobi-logtools
It is recommended to prepend the pip install command with python -m to ensure that the package is installed using the correct Python version currently active in your environment.
See CHANGELOG for added, removed or fixed functionality.
Usage
First, you need a set of Gurobi log files to compare, e.g.,
- results from several model instances
- comparisons of different parameter settings
- performance variability experiments involving multiple random seed runs
- ...
You may also use the provided gurobi-logtools.ipynb notebook with the example data set to get started. Additionally, there is a Gurobi TechTalk demonstrating how to use it (YouTube):

Pandas/Plotly
-
parse log files:
import gurobi_logtools as glt

results = glt.parse(["run1/*.log", "run2/*.log"])
summary = results.summary()
nodelog_progress = results.progress("nodelog")
Depending on your requirements, you may need to filter or modify the resulting DataFrames.
-
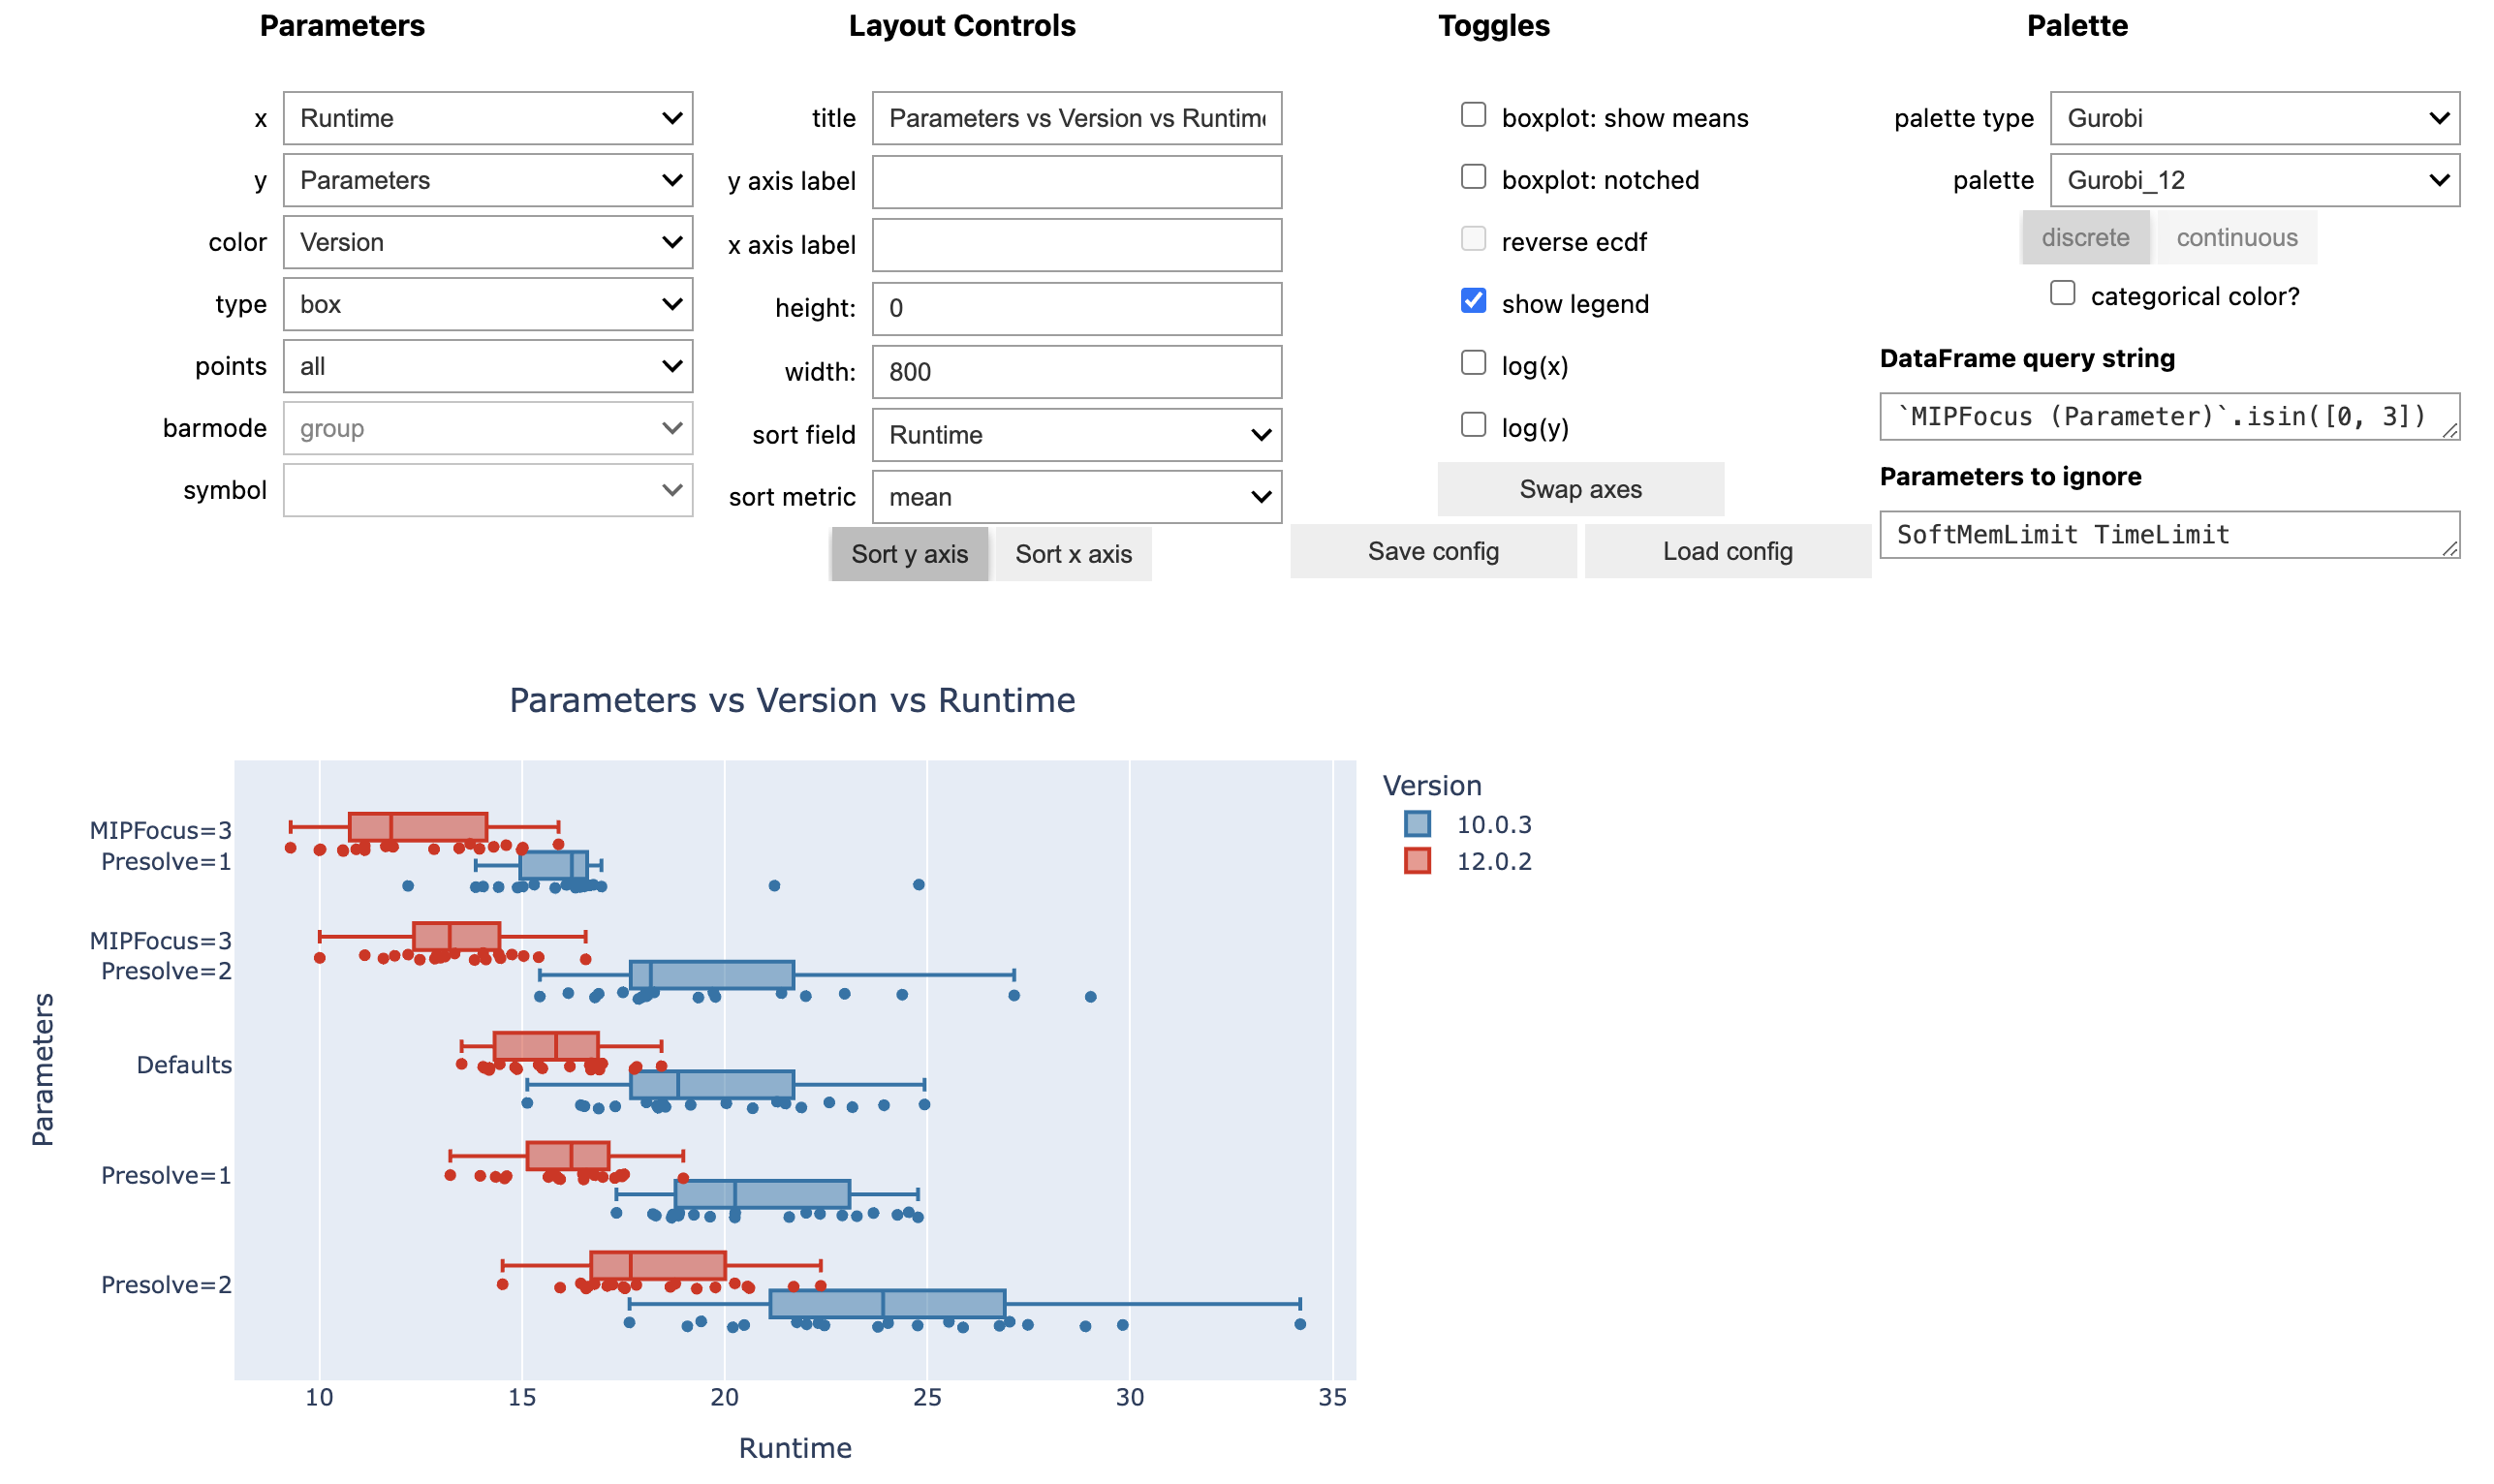
draw interactive charts, preferably in a Jupyter Notebook:
- final results from the individual runs:
glt.plot(summary, type="box")
- progress charts for the individual runs:
glt.plot(nodelog_progress, y="Gap", color="Log", type="line")
- progress of the norel heuristic (note, the time recorded here is since the start of norel, and does not include presolve + read time):
glt.plot(results.progress("norel"), x="Time", y="Incumbent", color="Log", type="line")
These are just examples using the Plotly Python library - of course, any other plotting library of your choice can be used to work with these DataFrames.
Excel
Convert your log files to Excel worksheets right on the command-line:
python -m gurobi_logtools myrun.xlsx data/*.log
List all available options and how to use the command-line tool:
python -m gurobi_logtools --help
Rename log files
The command line tool can also rename log files according to the parameters set and model solved in a given run. This is useful if your log files do not have a consistent naming scheme, or if multiple runs are logged per file and you want to extract the individual runs.
For example:
python -m gurobi_logtools --write-to-dir nicenames summary.xlsx tests/assets/combined/*.log
separates logs for individual runs in the input files and writes copies to the 'nicenames' folder with a consistent naming scheme:
> ls nicenames
912-MIPFocus1-Presolve1-TimeLimit600-glass4-0.log
912-MIPFocus1-Presolve1-TimeLimit600-glass4-1.log
912-MIPFocus1-Presolve1-TimeLimit600-glass4-2.log
912-MIPFocus2-Presolve1-TimeLimit600-glass4-0.log
912-MIPFocus2-Presolve1-TimeLimit600-glass4-1.log
912-MIPFocus2-Presolve1-TimeLimit600-glass4-2.log
912-Presolve1-TimeLimit600-glass4-0.log
912-Presolve1-TimeLimit600-glass4-1.log
912-Presolve1-TimeLimit600-glass4-2.log
Release history Release notifications | RSS feed

Download files
Download the file for your platform. If you're not sure which to choose, learn more about installing packages.
Source Distribution
Built Distribution
Hashes for gurobi_logtools-3.0.0-py3-none-any.whl
| Algorithm | Hash digest | |
|---|---|---|
| SHA256 | 3ffe1d8d0fc100cef9f475c8d5aae68282a397af98392a4392a6bd868efc5d9c |
|
| MD5 | 02018f6392d36e45745be2b405bd630b |
|
| BLAKE2b-256 | 736dca38e822c16873cb377ea8b6931a7e98385d33915b07d8333c2c39472765 |


