A Python package for delineating nested surface depressions in digital elevation data

Project description
Welcome to the lidar package


lidar is Python package for delineating the nested hierarchy of surface depressions in digital elevation models (DEMs). It is particularly useful for analyzing high-resolution topographic data, such as DEMs derived from Light Detection and Ranging (LiDAR) data.
- GitHub repo: https://github.com/opengeos/lidar
- Documentation: https://lidar.gishub.org
- PyPI: https://pypi.org/project/lidar
- Conda-forge: https://anaconda.org/conda-forge/lidar
- Open in Colab: https://gishub.org/lidar-colab
- Free software: MIT license
Citations
- Wu, Q., (2021). lidar: A Python package for delineating nested surface depressions from digital elevation data. Journal of Open Source Software, 6(59), 2965, https://doi.org/10.21105/joss.02965
- Wu, Q., Lane, C.R., Wang, L., Vanderhoof, M.K., Christensen, J.R., & Liu, H. (2019). Efficient Delineation of Nested Depression Hierarchy in Digital Elevation Models for Hydrological Analysis Using Level-Set Method. Journal of the American Water Resources Association. https://doi.org/10.1111/1752-1688.12689 (PDF)
Contents
- Introduction
- Statement of Need
- State of the Field
- Key Features
- Installation
- Usage
- References
- Contributing
- Credits
Introduction
lidar is a Python package for delineating the nested hierarchy of surface depressions in digital elevation models (DEMs). In traditional hydrological modeling, surface depressions in a DEM are commonly treated as artifacts and thus filled and removed to create a depressionless DEM, which can then be used to generate continuous stream networks. In reality, however, surface depressions in DEMs are commonly a combination of spurious and actual terrain features. Fine-resolution DEMs derived from Light Detection and Ranging (LiDAR) data can capture and represent actual surface depressions, especially in glaciated and karst landscapes. During the past decades, various algorithms have been developed to identify and delineate surface depressions, such as depression filling, depression breaching, hybrid breaching-filling, and contour tree method. More recently, a level-set method based on graph theory was proposed to delineate the nested hierarchy of surface depressions. The lidar Python package implements the level-set method and makes it possible for delineating the nested hierarchy of surface depressions as well as elevated terrain features. It also provides an interactive Graphical User Interface (GUI) that allows users to run the program with minimal coding.
Statement of Need
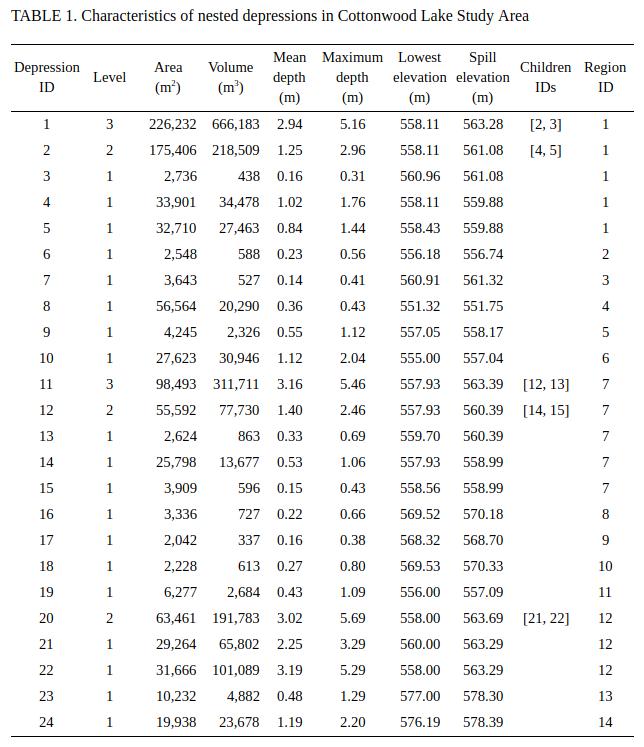
The lidar package is intended for scientists and researchers who would like to integrate surface depressions into hydrological modeling. It can also facilitate the identification and delineation of depressional features, such as sinkholes, detention basins, and prairie potholes. The detailed topological and geometric properties of surface depressions can be useful for terrain analysis and hydrological modeling, including the size, volume, mean depth, maximum depth, lowest elevation, spill elevation, perimeter, major axis length, minor axis length, elongatedness.
State of the Field
Currently, there are a few open-source Python packages that can perform depression filling on digital elevation data, such as RichDEM and whitebox, the Python frontend for WhiteboxTools. However, there are no Python packages offering tools for delineating the nested hierarchy of surface depressions and catchments as well as simulating inundation dynamics. The lidar Python package is intended for filling this gap.
Key Features
- Smoothing DEMs using mean, median, and Gaussian filters.
- Extracting depressions from DEMs.
- Filtering out small artifact depressions based on user-specified minimum depression size.
- Generating refined DEMs with small depressions filled but larger depressions kept intact.
- Delineating depression nested hierarchy using the level-set method.
- Delineating mount nested hierarchy using the level-set method.
- Computing topological and geometric properties of depressions, including size, volume, mean depth, maximum depth, lowest elevation, spill elevation, perimeter, major axis length, minor axis length, elongatedness, eccentricity, orientation, and area-bbox-ratio.
- Exporting depression properties as a csv file.
Installation
lidar supports a variety of platforms, including Microsoft Windows, macOS, and Linux operating systems. Note that you will need to have Python 3.x (< 3.9) installed. Python 2.x is not supported. lidar is available on both PyPI and conda-forge. lidar has a GDAL dependency, which can be challenging to install using pip on Windows. Therefore, it is highly recommended to install lidar from the conda-forge channel. If you encounter any errors, please check the Dependencies section below.
Install from PyPI
To install lidar from PyPI, run this command in your terminal:
pip install lidar
Install from conda-forage
If you have Anaconda or Miniconda installed on your computer, you can create a fresh conda environment to install lidar:
conda create -n geo python=3.11
conda activate geo
conda install -c conda-forge mamba
mamba install -c conda-forge lidar
Upgrade lidar
If you have installed lidar before and want to upgrade to the latest version, you can run the following command in your terminal:
pip install -U lidar
If you use conda, you can update lidar to the latest version by running the following command in your terminal:
mamba update -c conda-forge lidar
To install the development version from GitHub directly using Git, run the following code:
pip install git+https://github.com/opengeos/lidar
Dependencies
lidar's Python dependencies are listed in its requirements.txt file. In addition, lidar has a C library dependency: GDAL >=1.11.2. How to install GDAL in different operating systems will be explained below. More information about GDAL can be found here.
Linux
Debian-based Linux
The following commands can be used to install GDAL for Debian-based Linux distributions (e.g., Ubuntu, Linux Mint).
sudo add-apt-repository ppa:ubuntugis/ppa
sudo apt-get update
sudo apt-get install gdal-bin libgdal-dev
If you encounter any compiling errors, try the following commands.
sudo apt-get install --reinstall build-essential
sudo apt-get install python3-dev
pip install wheel
Pacman-based Linux
The following commands can be used to install GDAL for Pacman-based Linux distributions (e.g., Arch Linux, Manjaro). You might need to use sudo if you encounter permission errors.
sudo pacman -S yaourt --noconfirm
yaourt -S gdal --noconfirm
yaourt -S python-gdal --noconfirm
macOS
For a Homebrew based Python environment, do the following.
brew update
brew install gdal
Alternatively, you can install GDAL binaries from kyngchaos. You will
then need to add the installed location
/Library/Frameworks/GDAL.framework/Programs to your system path.
Windows
The instruction below assumes that you have installed Anaconda. Open Anaconda Prompt and enter the following commands to create a conda environment and install required packages
conda create -n geo python=3.11
conda activate geo
conda install -c conda-forge mamba
mamba install -c conda-forge lidar
When installing the lidar package, if you encounter an error
saying Microsoft Visual C++ 14.0 is required, please follow the steps
below to fix the error and reinstall lidar. More information can
be found at this link Fix Python 3 on Windows error - Microsoft Visual C++ 14.0 is required.
- Download Microsoft Build Tools for Visual Studio 2017
- Double click to install the downloaded installer - Microsoft Build Tools for Visual Studio 2017.
- Open Microsoft Build Tools for Visual Studio 2017
- Select Workloads --> Visual C++ build tools and click the install button
Usage
Launch the interactive notebook tutorial for the lidar Python package with Google Colab now:
A quick example
import os
import pkg_resources
from lidar import *

# identify the sample data directory of the package
package_name = 'lidar'
data_dir = pkg_resources.resource_filename(package_name, 'data/')

# use the sample dem. Change it to your own dem if needed
in_dem = os.path.join(data_dir, 'dem.tif')
# set the output directory
out_dir = os.getcwd()

# parameters for identifying sinks and delineating nested depressions
min_size = 1000      # minimum number of pixels as a depression
min_depth = 0.5      # minimum depth as a depression
interval = 0.3       # slicing interval for the level-set method
bool_shp = True      # output shapefiles for each individual level

# extracting sinks based on user-defined minimum depression size
out_dem = os.path.join(out_dir, "median.tif")
in_dem = MedianFilter(in_dem, kernel_size=3, out_file=out_dem)
sink_path = ExtractSinks(in_dem, min_size, out_dir)
dep_id_path, dep_level_path = DelineateDepressions(sink_path,
                                                   min_size,
                                                   min_depth,
                                                   interval,
                                                   out_dir,
                                                   bool_shp)
print('Results are saved in: {}'.format(out_dir))
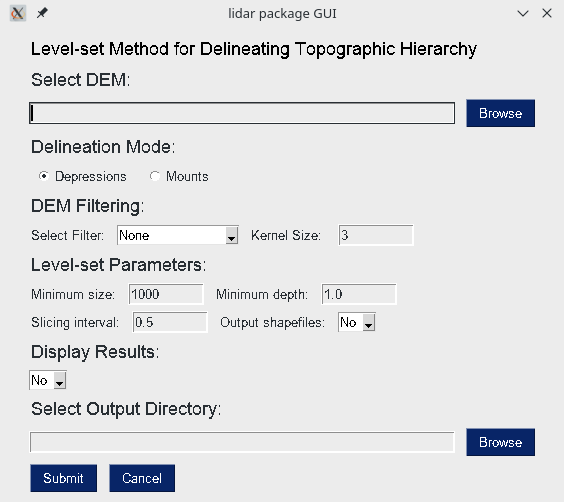
lidar GUI
lidar also provides a Graphical User Interface (GUI), which can be invoked using the following Python script:
import lidar
lidar.gui()
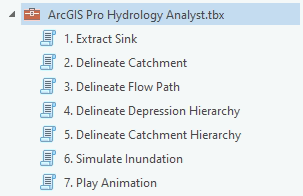
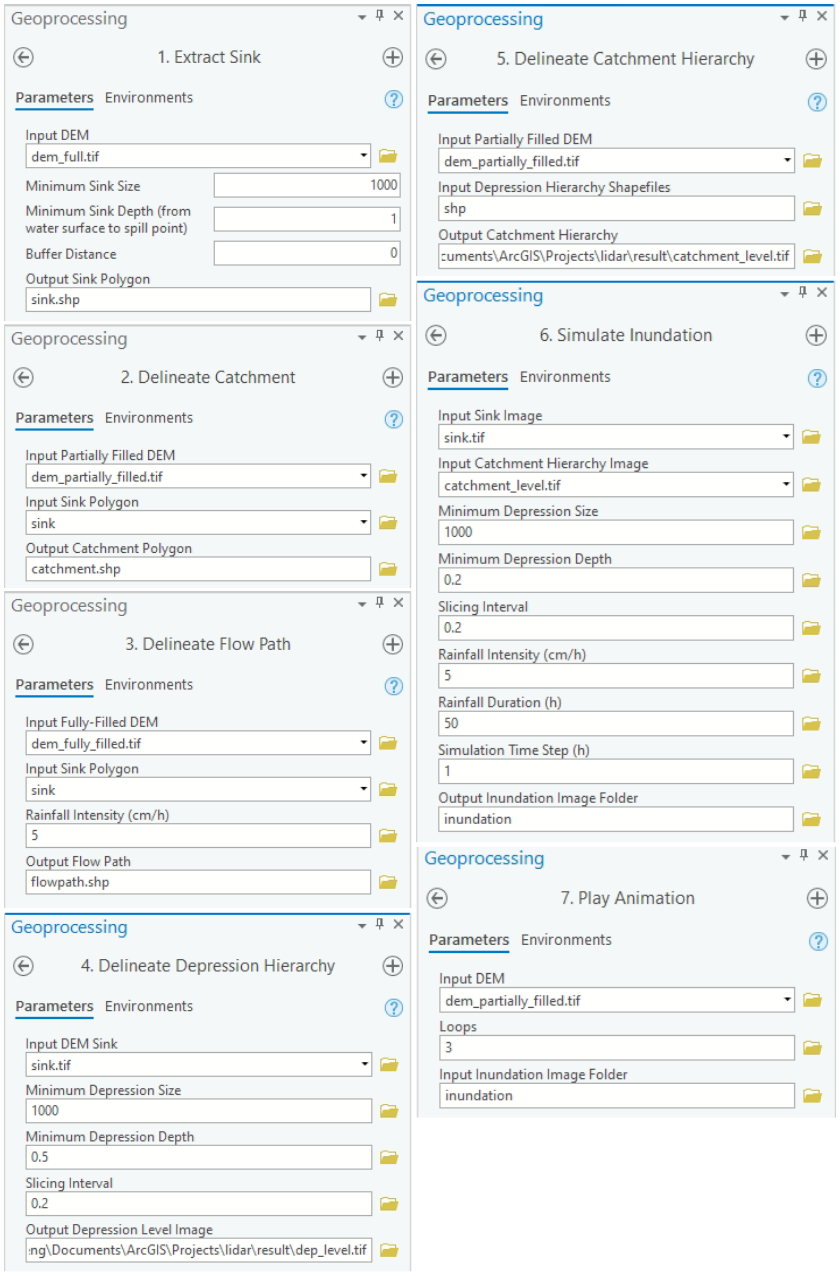
lidar toolbox for ArcGIS Pro
Toolbox interface
Video tutorials
Delineating nested surface depressions and catchments using ArcGIS Pro
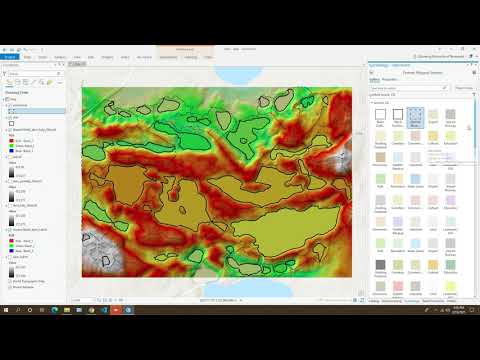
Delineating nested surface depressions and catchments using ArcMap
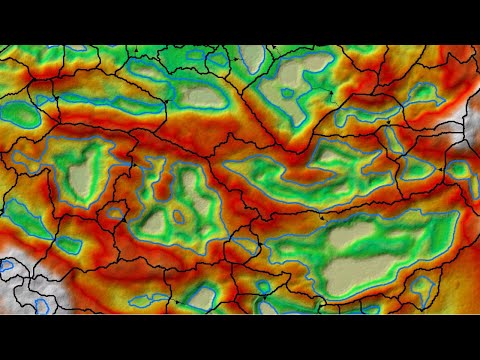
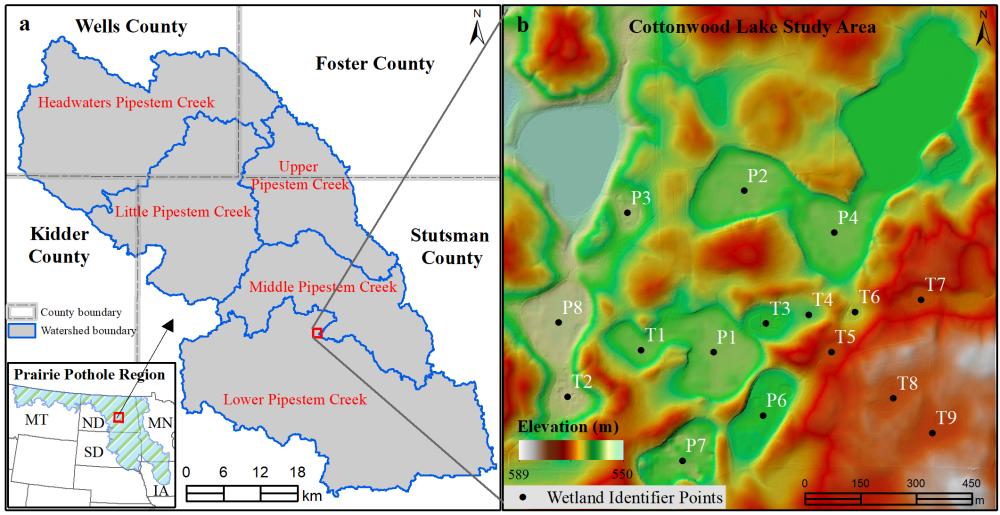
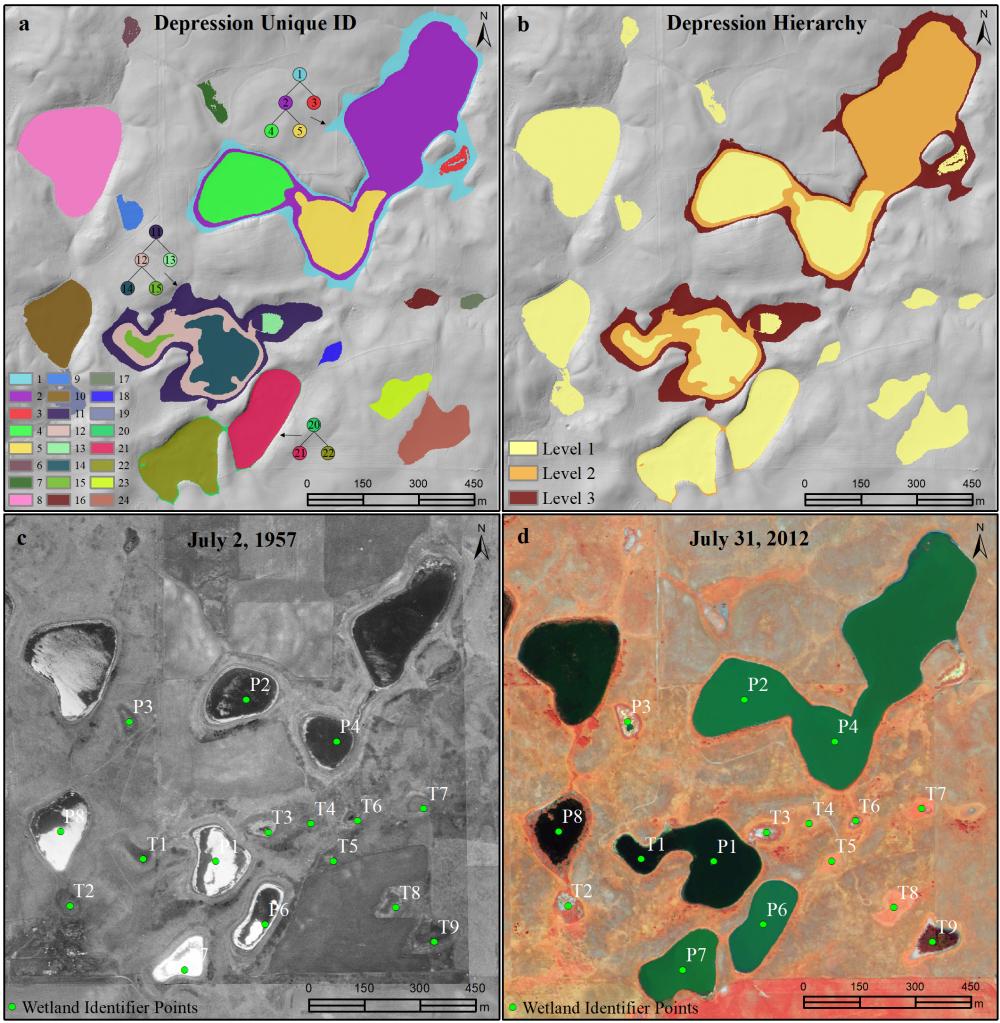
A real-world example
The images below show working examples of the level set method for delineating nested depressions in the Cottonwood Lake Study Area (CLSA), North Dakota. More test datasets (e.g., the Pipestem watershed in the Prairie Pothole Region of North Dakota) can be downloaded from http://gishub.org/2019-JAWRA-Data
The following example was conducted on a 64-bit Linux machine with a quad-core Intel i7-7700 CPU and 16 GB RAM. The average running time of the algorithm for this DEM was 0.75 seconds.
References
The level-set algorithm was proposed by Wu et al. (2019):
- Wu, Q., Lane, C.R., Wang, L., Vanderhoof, M.K., Christensen, J.R., & Liu, H. (2019). Efficient Delineation of Nested Depression Hierarchy in Digital Elevation Models for Hydrological Analysis Using Level-Set Method. Journal of the American Water Resources Association. DOI: 10.1111/1752-1688.12689 (PDF)
Applications of the level-set and contour-tree methods for feature extraction from LiDAR data:
- Wu, Q., & Lane, C.R. (2017). Delineating wetland catchments and modeling hydrologic connectivity using LiDAR data and aerial imagery. Hydrology and Earth System Sciences. 21: 3579-3595. DOI: 10.5194/hess-21-3579-2017
- Wu, Q., Deng, C., & Chen, Z. (2016). Automated delineation of karst sinkholes from LiDAR-derived digital elevation models. Geomorphology. 266: 1-10. DOI: 10.1016/j.geomorph.2016.05.006
- Wu, Q., Su, H., Sherman, D.J., Liu, H., Wozencraft, J.M., Yu, B., & Chen, Z. (2016). A graph-based approach for assessing storm-induced coastal changes. International Journal of Remote Sensing. 37:4854-4873. DOI: 10.1080/01431161.2016.1225180
- Wu, Q., & Lane, C.R. (2016). Delineation and quantification of wetland depressions in the Prairie Pothole Region of North Dakota. Wetlands. 36(2):215–227. DOI: 10.1007/s13157-015-0731-6
- Wu, Q., Liu, H., Wang, S., Yu, B., Beck, R., & Hinkel, K. (2015). A localized contour tree method for deriving geometric and topological properties of complex surface depressions based on high-resolution topographic data. International Journal of Geographical Information Science. 29(12): 2041-2060. DOI: 10.1080/13658816.2015.1038719
- Wu, Q., Lane, C.R., & Liu, H. (2014). An effective method for detecting potential woodland vernal pools using high-resolution LiDAR data and aerial imagery. Remote Sensing. 6(11):11444-11467. DOI: 10.3390/rs61111444
Contributing
Contributions are welcome, and they are greatly appreciated! Every little bit helps, and credit will always be given. You can contribute in many ways:
Types of Contributions
Report Bugs
Report bugs at https://github.com/opengeos/lidar/issues.
If you are reporting a bug, please include:
- Your operating system name and version.
- Any details about your local setup that might be helpful in troubleshooting.
- Detailed steps to reproduce the bug.
Fix Bugs
Look through the GitHub issues for bugs. Anything tagged with "bug" and "help wanted" is open to whoever wants to implement it.
Implement Features
Look through the GitHub issues for features. Anything tagged with "enhancement" and "help wanted" is open to whoever wants to implement it.
Write Documentation
lidar could always use more documentation, whether as part of the official lidar docs, in docstrings, or even on the web in blog posts, articles, and such.
Submit Feedback
The best way to send feedback is to file an issue at https://github.com/opengeos/lidar/issues.
If you are proposing a feature:
- Explain in detail how it would work.
- Keep the scope as narrow as possible, to make it easier to implement.
- Remember that this is a volunteer-driven project, and that contributions are welcome.
Get Started
Ready to contribute? Here's how to set up lidar for local development.
-
Fork the lidar repo on GitHub.
-
Clone your fork locally:
git clone git@github.com:your_name_here/lidar.git
- Install your local copy into a conda env. Assuming you have conda installed, this is how you set up your fork for local development:
conda create -n lidar-test python
conda activate lidar-test
cd lidar/
pip install -e .
- Create a branch for local development:
git checkout -b name-of-your-bugfix-or-feature
Now you can make your changes locally.
- When you're done making changes, check that your changes pass flake8 and the tests, including testing other Python versions with tox:
flake8 lidar tests
python setup.py test or pytest
To get flake8 and tox, just pip install them into your conda env.
- Commit your changes and push your branch to GitHub:
git add .
git commit -m "Your detailed description of your changes."
git push origin name-of-your-bugfix-or-feature
- Submit a pull request through the GitHub website.
Pull Request Guidelines
Before you submit a pull request, check that it meets these guidelines:
- The pull request should include tests.
- If the pull request adds functionality, the docs should be updated. Put your new functionality into a function with a docstring, and add the feature to the list in README.md.
- The pull request should work for Python 3.7 and 3.8. Check https://github.com/opengeos/lidar/actions and make sure that the tests pass for all supported Python versions.
Credits
- The algorithms are built on RichDEM, numpy, scipy, scikit-image, and pygdal.
- This package was created with Cookiecutter and the audreyr/cookiecutter-pypackage project template.


