OmniXAI: An Explainable AI Toolbox

Project description

OmniXAI: A Library for Explainable AI


Table of Contents
- Introduction
- Installation
- Getting Started
- Documentation
- Tutorials
- Deployment
- Dashboard Demo
- How to Contribute
- Technical Report and Citing OmniXAI
What's New
The latest version includes an experimental GPT explainer. This explainer leverages the outcomes produced by SHAP and MACE to formulate the input prompt for ChatGPT. Subsequently, ChatGPT analyzes these results and generates the corresponding explanations that provide developers with a clearer understanding of the rationale behind the model's predictions.
Introduction
OmniXAI (short for Omni eXplainable AI) is a Python machine-learning library for explainable AI (XAI), offering omni-way explainable AI and interpretable
machine learning capabilities to address many pain points in explaining decisions made by machine learning
models in practice. OmniXAI aims to be a one-stop comprehensive library that makes explainable AI easy for
data scientists, ML researchers and practitioners who need explanation for various types of data, models and
explanation methods at different stages of ML process:
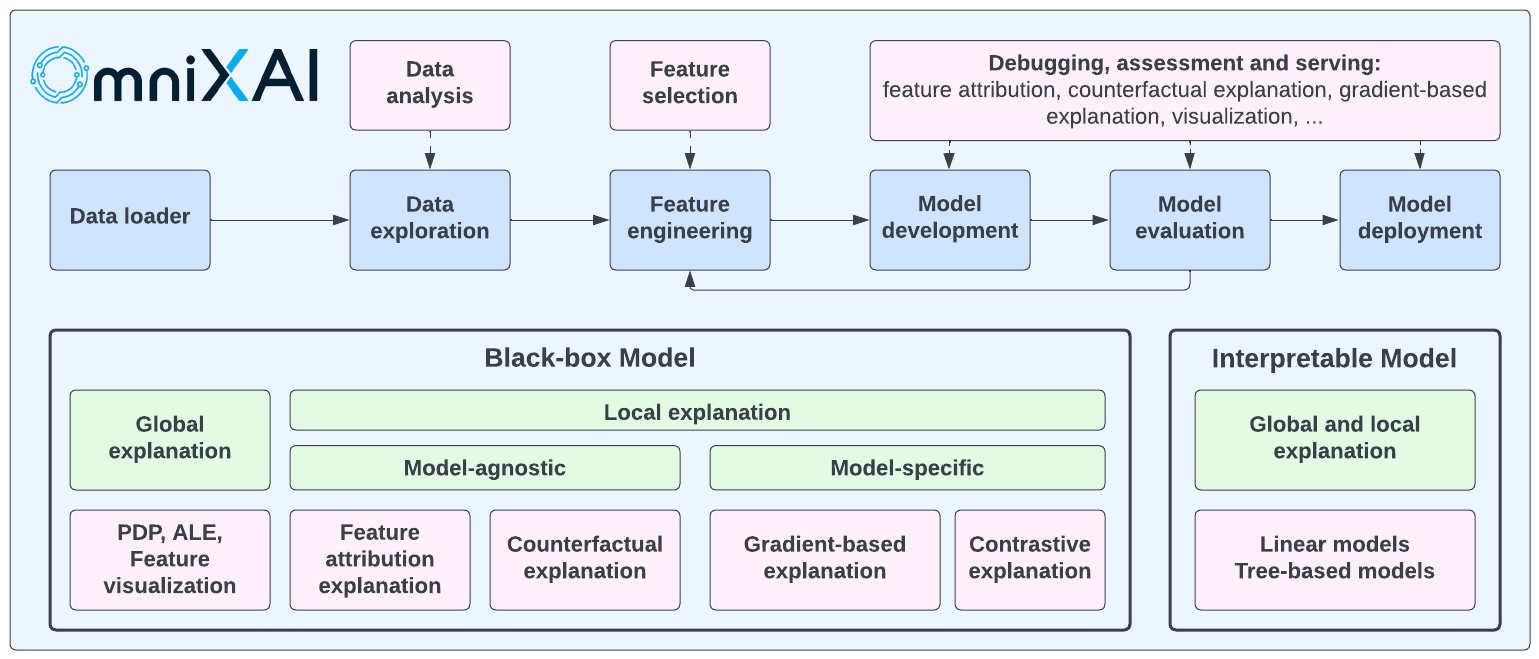
OmniXAI includes a rich family of explanation methods integrated in a unified interface, which supports multiple data types (tabular data, images, texts, time-series), multiple types of ML models (traditional ML in Scikit-learn and deep learning models in PyTorch/TensorFlow), and a range of diverse explaination methods including "model-specific" and "model-agnostic" methods (such as feature-attribution explanation, counterfactual explanation, gradient-based explanation, feature visualization, etc). For practitioners, OmniXAI provides an easy-to-use unified interface to generate the explanations for their applications by only writing a few lines of codes, and also a GUI dashboard for visualization for obtaining more insights about decisions.
The following table shows the supported explanation methods and features in our library. We will continue improving this library to make it more comprehensive in the future.
| Method | Model Type | Explanation Type | EDA | Tabular | Image | Text | Timeseries |
|---|---|---|---|---|---|---|---|
| Feature analysis | NA | Global | ✅ | ||||
| Feature selection | NA | Global | ✅ | ||||
| Prediction metrics | Black box | Global | ✅ | ✅ | ✅ | ✅ | |
| Bias metrics | Black box | Global | ✅ | ||||
| Partial dependence plots | Black box | Global | ✅ | ||||
| Accumulated local effects | Black box | Global | ✅ | ||||
| Sensitivity analysis | Black box | Global | ✅ | ||||
| Permutation explanation | Black box | Global | ✅ | ||||
| Feature visualization | Torch or TF | Global | ✅ | ||||
| Feature maps | Torch or TF | Local | ✅ | ||||
| GPT explainer | Black box | Local | ✅ | ||||
| LIME | Black box | Local | ✅ | ✅ | ✅ | ||
| SHAP | Black box* | Local | ✅ | ✅ | ✅ | ✅ | |
| What-if | Black box | Local | ✅ | ||||
| Integrated gradient | Torch or TF | Local | ✅ | ✅ | ✅ | ||
| Counterfactual | Black box* | Local | ✅ | ✅ | ✅ | ✅ | |
| Contrastive explanation | Torch or TF | Local | ✅ | ||||
| Grad-CAM, Grad-CAM++ | Torch or TF | Local | ✅ | ||||
| Score-CAM | Torch or TF | Local | ✅ | ||||
| Layer-CAM | Torch or TF | Local | ✅ | ||||
| Smooth gradient | Torch or TF | Local | ✅ | ||||
| Guided backpropagation | Torch or TF | Local | ✅ | ||||
| Learning to explain | Black box | Local | ✅ | ✅ | ✅ | ||
| Linear models | Linear models | Global and Local | ✅ | ||||
| Tree models | Tree models | Global and Local | ✅ |
SHAP accepts black box models for tabular data, PyTorch/Tensorflow models for image data, transformer models for text data. Counterfactual accepts black box models for tabular, text and time-series data, and PyTorch/Tensorflow models for image data.
This table shows the comparison between our toolkit/library and other existing XAI toolkits/libraries in literature.
OmniXAI also integrates ChatGPT for generating plain text explanations given a classification/regression model on tabular datasets. The generated results may not be 100% accurate, but it is worth trying this explainer (we will continue improving the input prompts).
Installation
You can install omnixai from PyPI by calling pip install omnixai. You may install from source by
cloning the OmniXAI repo, navigating to the root directory, and calling
pip install ., or pip install -e . to install in editable mode. You may install additional dependencies:
- For plotting & visualization: Calling
pip install omnixai[plot], orpip install .[plot]from the root directory of the repo. - For vision tasks: Calling
pip install omnixai[vision], orpip install .[vision]from the root directory of the repo. - For NLP tasks: Calling
pip install omnixai[nlp], orpip install .[nlp]from the root directory of the repo. - Install all the dependencies: Calling
pip install omnixai[all], orpip install .[all]from the root directory of the repo.
Getting Started
For example code and an introduction to the library, see the Jupyter notebooks in tutorials, and the guided walkthrough here. A dashboard demo can be found here.
Some examples:
- Tabular classification
- Tabular regression
- Image classification
- Text classification
- Time-series anomaly detection
- Vision-language tasks
- Ranking tasks
- Feature visualization
- Check feature maps
- GPT explainer for tabular
To get started, we recommend the linked tutorials in tutorials.
In general, we recommend using TabularExplainer, VisionExplainer,
NLPExplainer and TimeseriesExplainer for tabular, vision, NLP and time-series tasks, respectively, and using
DataAnalyzer and PredictionAnalyzer for feature analysis and prediction result analysis.
These classes act as the factories of the individual explainers supported in OmniXAI, providing a simpler
interface to generate multiple explanations. To generate explanations, you only need to specify
- The ML model to explain: e.g., a scikit-learn model, a tensorflow model, a pytorch model or a black-box prediction function.
- The pre-processing function: i.e., converting raw input features into the model inputs.
- The post-processing function (optional): e.g., converting the model outputs into class probabilities.
- The explainers to apply: e.g., SHAP, MACE, Grad-CAM.
Besides using these classes, you can also create a single explainer defined in the omnixai.explainers package, e.g.,
ShapTabular, GradCAM, IntegratedGradient or FeatureVisualizer.
Let's take the income prediction task as an example.
The dataset used in this example is for income prediction.
We recommend using data class Tabular to represent a tabular dataset. To create a Tabular instance given a pandas
dataframe, you need to specify the dataframe, the categorical feature names (if exists) and the target/label
column name (if exists).
from omnixai.data.tabular import Tabular
# Load the dataset
feature_names = [
   "Age", "Workclass", "fnlwgt", "Education",
   "Education-Num", "Marital Status", "Occupation",
   "Relationship", "Race", "Sex", "Capital Gain",
   "Capital Loss", "Hours per week", "Country", "label"
]
df = pd.DataFrame(
  np.genfromtxt('adult.data', delimiter=', ', dtype=str),
  columns=feature_names
)
tabular_data = Tabular(
   df,
   categorical_columns=[feature_names[i] for i in [1, 3, 5, 6, 7, 8, 9, 13]],
   target_column='label'
)
The package omnixai.preprocessing provides several useful preprocessing functions
for a Tabular instance. TabularTransform is a special transform designed for processing tabular data.
By default, it converts categorical features into one-hot encoding, and keeps continuous-valued features.
The method transform of TabularTransform transforms a Tabular instance to a numpy array.
If the Tabular instance has a target/label column, the last column of the numpy array
will be the target/label. You can apply any customized preprocessing functions instead of using TabularTransform.
After data preprocessing, let's train a XGBoost classifier for this task.
from omnixai.preprocessing.tabular import TabularTransform
# Data preprocessing
transformer = TabularTransform().fit(tabular_data)
class_names = transformer.class_names
x = transformer.transform(tabular_data)
# Split into training and test datasets
train, test, train_labels, test_labels = \
    sklearn.model_selection.train_test_split(x[:, :-1], x[:, -1], train_size=0.80)
# Train an XGBoost model (the last column of `x` is the label column after transformation)
model = xgboost.XGBClassifier(n_estimators=300, max_depth=5)
model.fit(train, train_labels)
# Convert the transformed data back to Tabular instances
train_data = transformer.invert(train)
test_data = transformer.invert(test)
To initialize TabularExplainer, the following parameters need to be set:
explainers: The names of the explainers to apply, e.g., ["lime", "shap", "mace", "pdp"].data: The data used to initialize explainers.datais the training dataset for training the machine learning model. If the training dataset is too large,datacan be a subset of it by applyingomnixai.sampler.tabular.Sampler.subsample.model: The ML model to explain, e.g., a scikit-learn model, a tensorflow model or a pytorch model.preprocess: The preprocessing function converting the raw inputs (ATabularinstance) into the inputs ofmodel.postprocess(optional): The postprocessing function transforming the outputs ofmodelto a user-specific form, e.g., the predicted probability for each class. The output ofpostprocessshould be a numpy array.mode: The task type, e.g., "classification" or "regression".
The preprocessing function takes a Tabular instance as its input and outputs the processed features that
the ML model consumes. In this example, we simply call transformer.transform. If you use some customized transforms
on pandas dataframes, the preprocess function has this format: lambda z: some_transform(z.to_pd()). If the output of model
is not a numpy array, postprocess needs to be set to convert it into a numpy array.
from omnixai.explainers.tabular import TabularExplainer
# Initialize a TabularExplainer
explainer = TabularExplainer(
  explainers=["lime", "shap", "mace", "pdp", "ale"], # The explainers to apply
  mode="classification",                             # The task type
  data=train_data,                                   # The data for initializing the explainers
  model=model,                                       # The ML model to explain
  preprocess=lambda z: transformer.transform(z),     # Converts raw features into the model inputs
  params={
     "mace": {"ignored_features": ["Sex", "Race", "Relationship", "Capital Loss"]}
  }                                                  # Additional parameters
)
In this example, LIME, SHAP and MACE generate local explanations while PDP (partial dependence plot)
generates global explanations. explainer.explain returns the local explanations generated by the
three methods given the test instances, and explainer.explain_global returns the global explanations
generated by PDP. TabularExplainer hides all the details behind the explainers, so we can simply call
these two methods to generate explanations.
# Generate explanations
test_instances = test_data[:5]
local_explanations = explainer.explain(X=test_instances)
global_explanations = explainer.explain_global(
    params={"pdp": {"features": ["Age", "Education-Num", "Capital Gain",
                                 "Capital Loss", "Hours per week", "Education",
                                 "Marital Status", "Occupation"]}}
)
Similarly, we create a PredictionAnalyzer for computing performance metrics for this classification task.
To initialize PredictionAnalyzer, the following parameters need to be set:
mode: The task type, e.g., "classification" or "regression".test_data: The test dataset, which should be aTabularinstance.test_targets: The test labels or targets. For classification,test_targetsshould be integers (processed by a LabelEncoder) and match the class probabilities returned by the ML model.preprocess: The preprocessing function converting the raw data (aTabularinstance) into the inputs ofmodel.postprocess(optional): The postprocessing function transforming the outputs ofmodelto a user-specific form, e.g., the predicted probability for each class. The output ofpostprocessshould be a numpy array.
from omnixai.explainers.prediction import PredictionAnalyzer

analyzer = PredictionAnalyzer(
    mode="classification",
    test_data=test_data,                           # The test dataset (a `Tabular` instance)
    test_targets=test_labels,                      # The test labels (a numpy array)
    model=model,                                   # The ML model
    preprocess=lambda z: transformer.transform(z)  # Converts raw features into the model inputs
)
prediction_explanations = analyzer.explain()
Given the generated explanations, we can launch a dashboard (a Dash app) for visualization by setting the test
instance, the local explanations, the global explanations, the prediction metrics, the class names, and additional
parameters for visualization (optional). If you want "what-if" analysis, you can set the explainer parameter
when initializing the dashboard. For "what-if" analysis, OmniXAI also allows you to set a second explainer
if you want to compare different models.
from omnixai.visualization.dashboard import Dashboard
# Launch a dashboard for visualization
dashboard = Dashboard(
   instances=test_instances,                        # The instances to explain
   local_explanations=local_explanations,           # Set the local explanations
   global_explanations=global_explanations,         # Set the global explanations
   prediction_explanations=prediction_explanations, # Set the prediction metrics
   class_names=class_names,                         # Set class names
   explainer=explainer                              # The created TabularExplainer for what if analysis
)
dashboard.show()                                    # Launch the dashboard
After opening the Dash app in the browser, we will see a dashboard showing the explanations:
You can also use the GPT explainer to generate explanations in text for tabular models:
explainer = TabularExplainer(
  explainers=["gpt"],                                # The GPT explainer to apply
  mode="classification",                             # The task type
  data=train_data,                                   # The data for initializing the explainers
  model=model,                                       # The ML model to explain
  preprocess=lambda z: transformer.transform(z),     # Converts raw features into the model inputs
  params={
     "gpt": {"apikey": "xxxx"}
  }                                                  # Set the OpenAI API KEY
)
local_explanations = explainer.explain(X=test_instances)
For vision tasks, the same interface is used to create explainers and generate explanations. Let's take an image classification model as an example.
from omnixai.explainers.vision import VisionExplainer
from omnixai.visualization.dashboard import Dashboard

explainer = VisionExplainer(
    explainers=["gradcam", "lime", "ig", "ce", "feature_visualization"],
    mode="classification",
    model=model,                   # An image classification model, e.g., ResNet50
    preprocess=preprocess,         # The preprocessing function
    postprocess=postprocess,       # The postprocessing function
    params={
        # Set the target layer for GradCAM
        "gradcam": {"target_layer": model.layer4[-1]},
        # Set the objective for feature visualization
        "feature_visualization":
          {"objectives": [{"layer": model.layer4[-3], "type": "channel", "index": list(range(6))}]}
    },
)
# Generate explanations of GradCAM, LIME, IG and CE
local_explanations = explainer.explain(test_img)
# Generate explanations of feature visualization
global_explanations = explainer.explain_global()
# Launch the dashboard
dashboard = Dashboard(
    instances=test_img,
    local_explanations=local_explanations,
    global_explanations=global_explanations
)
dashboard.show()
The following figure shows the dashboard of these explanations:
For NLP tasks and time-series forecasting/anomaly detection, OmniXAI also provides the same interface
to generate and visualize explanations. This figure shows a dashboard example of text classification
and time-series anomaly detection:
Deployment
The explainers in OmniXAI can be easily deployed via BentoML. BentoML is a popular open-source unified model serving framework, supporting multiple platforms including AWS, GCP, Heroku, etc. We implemented the BentoML-format interfaces for OmniXAI so that users only need few lines of code to deploy their selected explainers.
Let's take the income prediction task as an example. Given the trained model and the initialized explainer, you only need to save the explainer in the BentoML local model store:
from omnixai.explainers.tabular import TabularExplainer
from omnixai.deployment.bentoml.omnixai import save_model

explainer = TabularExplainer(
  explainers=["lime", "shap", "mace", "pdp", "ale"],
  mode="classification",
  data=train_data,
  model=model,
  preprocess=lambda z: transformer.transform(z),
  params={
     "mace": {"ignored_features": ["Sex", "Race", "Relationship", "Capital Loss"]}
  }
)
save_model("tabular_explainer", explainer)
And then create a file (e.g., service.py) for the ML service code:
from omnixai.deployment.bentoml.omnixai import init_service

svc = init_service(
    model_tag="tabular_explainer:latest",
    task_type="tabular",
    service_name="tabular_explainer"
)
The init_service function defines two API endpoints, i.e., /predict for model predictions and /explain for
generating explanations. You can start an API server locally to test the service code above:
bentoml serve service:svc --reload
The endpoints can be accessed locally:
import requests
from requests_toolbelt.multipart.encoder import MultipartEncoder

data = '["39", "State-gov", "77516", "Bachelors", "13", "Never-married", ' \
       '"Adm-clerical", "Not-in-family", "White", "Male", "2174", "0", "40", "United-States"]'

# Test the prediction endpoint
prediction = requests.post(
    "http://0.0.0.0:3000/predict",
    headers={"content-type": "application/json"},
    data=data
).text

# Test the explanation endpoint
m = MultipartEncoder(
    fields={
        "data": data,
        "params": '{"lime": {"y": [0]}}',
    }
)
result = requests.post(
    "http://0.0.0.0:3000/explain",
    headers={"Content-Type": m.content_type},
    data=m
).text

# Parse the results
from omnixai.explainers.base import AutoExplainerBase
exp = AutoExplainerBase.parse_explanations_from_json(result)
for name, explanation in exp.items():
    explanation.ipython_plot()
You can build Bento for deployment by following the steps shown in the BentoML repo. For more examples, please check Tabular, Vision, NLP.
How to Contribute
We welcome the contribution from the open-source community to improve the library!
To add a new explanation method/feature into the library, please follow the template and steps demonstrated in this documentation.
Technical Report and Citing OmniXAI
You can find more details in our technical report: https://arxiv.org/abs/2206.01612
If you're using OmniXAI in your research or applications, please cite using this BibTeX:
@article{wenzhuo2022-omnixai,
  author    = {Wenzhuo Yang and Hung Le and Silvio Savarese and Steven Hoi},
  title     = {OmniXAI: A Library for Explainable AI},
  year      = {2022},
  doi       = {10.48550/ARXIV.2206.01612},
  url       = {https://arxiv.org/abs/2206.01612},
  archivePrefix = {arXiv},
  eprint    = {206.01612},
}
Contact Us
If you have any questions, comments or suggestions, please do not hesitate to contact us at omnixai@salesforce.com.


