Project that redirects Prometheus Alert Manager notifications to Microsoft Teams

Project description


prom2teams: Prometheus Alertmanager/Microsoft Teams integration
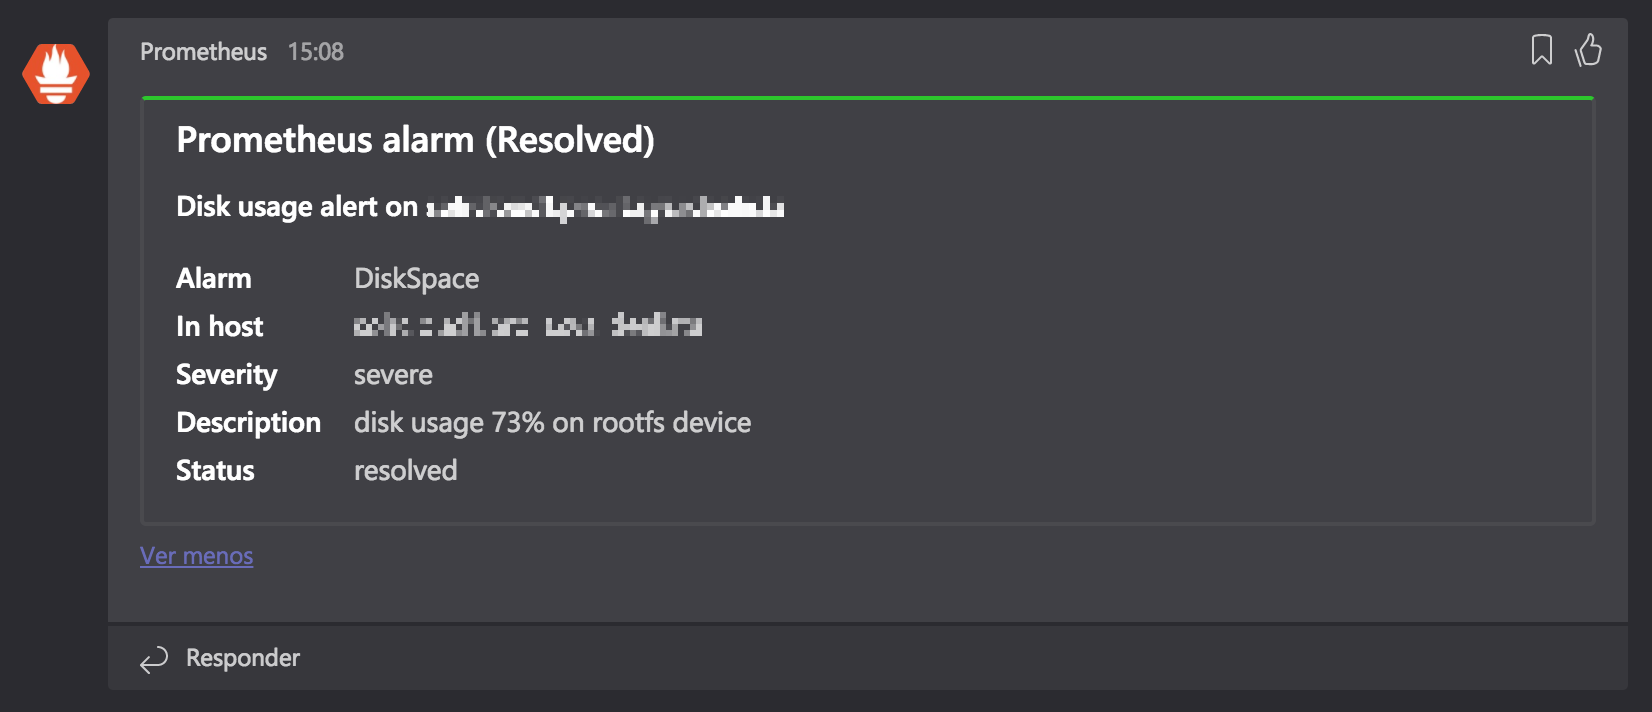
prom2teams is a service built with Python that receives alert notifications from a previously configured Prometheus Alertmanager instance and forwards it to Microsoft Teams using defined connectors.
It presents grouping of alerts, labels/annotations exclusion and a Teams' alert retry policy among its key features.
Getting Started
Prerequisites
The application has been tested with Prometheus 2.2.1, Python 3.8.0 and pip 9.0.1.
Newer versions of Prometheus/Python/pip should work but could also present issues.
Installing
prom2teams is present on PyPI, so could be installed using pip3:
$ pip3 install prom2teams
Note: Works since v1.1.1
Usage
Important: Config path must be provided with at least one Microsoft Teams Connector. Check the options to know how you can supply it.
# To start the server (enable metrics, config file path , group alerts by, log file path, log level and Jinja2 template path are optional arguments):
$ prom2teams [--enablemetrics] [--configpath <config file path>] [--groupalertsby ("name"|"description"|"instance"|"severity"|"summary")] [--logfilepath <log file path>] [--loglevel (DEBUG|INFO|WARNING|ERROR|CRITICAL)] [--templatepath <Jinja2 template file path>]

# To show the help message:
$ prom2teams --help
Other options to start the service are:
export APP_CONFIG_FILE=<config file path>
$ prom2teams
Note: Grouping alerts works since v2.2.1
Docker image
Every new Prom2teams release, a new Docker image is built in our Dockerhub. We strongly recommend you to use the images with the version tag, though it will be possible to use them without it.
There are two things you need to bear in mind when creating a Prom2teams container:
- The connector URL must be passed as the environment variable
PROM2TEAMS_CONNECTOR - In case you want to group alerts, you need to pass the field as the environment variable
PROM2TEAMS_GROUP_ALERTS_BY - You need to map container's Prom2teams port to one on your host.
So a sample Docker run command would be:
$ docker run -it -d -e PROM2TEAMS_GROUP_ALERTS_BY=FIELD_YOU_WANT_TO_GROUP_BY -e PROM2TEAMS_CONNECTOR="CONNECTOR_URL" -p 8089:8089 idealista/prom2teams:VERSION
Provide custom config file
If you prefer to use your own config file, you just need to provide it as a Docker volume to the container and map it to /opt/prom2teams/config.ini. Sample:
$ docker run -it -d -v pathToTheLocalConfigFile:/opt/prom2teams/config.ini -p 8089:8089 idealista/prom2teams:VERSION
Helm chart
Installing the Chart
To install the chart with the release name my-release run:
$ helm install --name my-release /location/of/prom2teams_ROOT/helm
After a few seconds, Prom2Teams should be running.
Tip: List all releases using
helm list, a release is a name used to track a specific deployment
Uninstalling the Chart
To uninstall/delete the my-release deployment:
Helm 2
$ helm delete my-release
Tip: Use helm delete --purge my-release to completely remove the release from Helm internal storage
The command removes all the Kubernetes components associated with the chart and deletes the release.
Helm 3
$ helm uninstall my-release
The command removes all the Kubernetes components associated with the chart and deletes the release.
Configuration
The following table lists the configurable parameters of the Prom2teams chart and their default values.
| Parameter | Description | Default |
|---|---|---|
image.repository |
The image repository to pull from | idealista/prom2teams |
image.tag |
The image tag to pull | <empty> |
image.pullPolicy |
The image pull policy | IfNotPresent |
resources.requests.cpu |
CPU requested for being run in a node | 100m |
resources.requests.memory |
Memory requested for being run in a node | 128Mi |
resources.limits.cpu |
CPU limit | 200m |
resources.limits.memory |
Memory limit | 200Mi |
service.type |
Service Map (NodePort/ClusterIP) | ClusterIP |
service.port |
Service Port | 8089 |
prom2teams.host |
IP to bind to | 0.0.0.0 |
prom2teams.port |
Port to bind to | 8089 |
prom2teams.connector |
Connector URL | <empty> |
prom2teams.connectors |
A map where the keys are the connector names and the values are the connector webhook urls | {} |
prom2teams.group_alerts_by |
Group_alerts_by field | <empty> |
prom2teams.loglevel |
Loglevel | INFO |
prom2teams.templatepath |
Custom Template path (files/teams.j2) | /opt/prom2teams/helmconfig/teams.j2 |
prom2teams.config |
Config (specific to Helm) | /opt/prom2teams/helmconfig/config.ini |
prom2teams.extraEnv |
Dictionary of arbitrary additional environment variables for deployment (eg. HTTP_PROXY) |
<empty> |
Production
For production environments you should prefer using a WSGI server. uWSGI dependency is installed for an easy usage. Some considerations must be taken to use it:
The binary prom2teams_uwsgi launches the app using the uwsgi server. Due to some incompatibilities with wheel
you must install prom2teams using sudo pip install --no-binary :all: prom2teams (https://github.com/pypa/wheel/issues/92)
$ prom2teams_uwsgi <path to uwsgi ini config>
And uwsgi would look like:
[uwsgi]
master = true
processes = 5
#socket = 0.0.0.0:8001
#protocol = http
socket = /tmp/prom2teams.sock
chmod-socket = 777
vacuum = true
env = APP_ENVIRONMENT=pro
env = APP_CONFIG_FILE=/etc/default/prom2teams.ini
Consider not provide chdir property neither module property.
Also you can set the module file, by doing a symbolic link: sudo mkdir -p /usr/local/etc/prom2teams/ && sudo ln -sf /usr/local/lib/python3.7/dist-packages/usr/local/etc/prom2teams/wsgi.py /usr/local/etc/prom2teams/wsgi.py (check your dist-packages folder)
Another approach is to provide yourself the module file module example and the bin uwsgi call uwsgi example
Note: default log level is DEBUG. Messages are redirected to stdout. To enable file log, set the env APP_ENVIRONMENT=(pro|pre)
Config file
The config file is an INI file and should have the structure described below:
[Microsoft Teams]
# At least one connector is required here
Connector: <webhook url>
AnotherConnector: <webhook url>
...

[HTTP Server]
Host: <host ip> # default: localhost
Port: <host port> # default: 8089

[Log]
Level: <loglevel (DEBUG|INFO|WARNING|ERROR|CRITICAL)> # default: DEBUG
Path: <log file path>  # default: /var/log/prom2teams/prom2teams.log

[Template]
Path: <Jinja2 template path> # default: app resources default template (./prom2teams/resources/templates/teams.j2)

[Group Alerts]
Field: <Field to group alerts by> # alerts won't be grouped by default

[Labels]
Excluded: <Comma separated list of labels to ignore>

[Annotations]
Excluded: <Comma separated list of annotations to ignore>

[Teams Client]
RequestTimeout: <Configures the request timeout> # defaults to 30 secs
RetryEnable: <Enables teams client retry policy> # defaults to false
RetryWaitTime: <Wait time between retries> # default: 60 secs
MaxPayload: <Teams client payload limit in bytes> # default: 24KB
Note: Grouping alerts works since v2.2.0
Configuring Prometheus
The webhook receiver in Prometheus allows configuring a prom2teams server.
The url is formed by the host and port defined in the previous step.
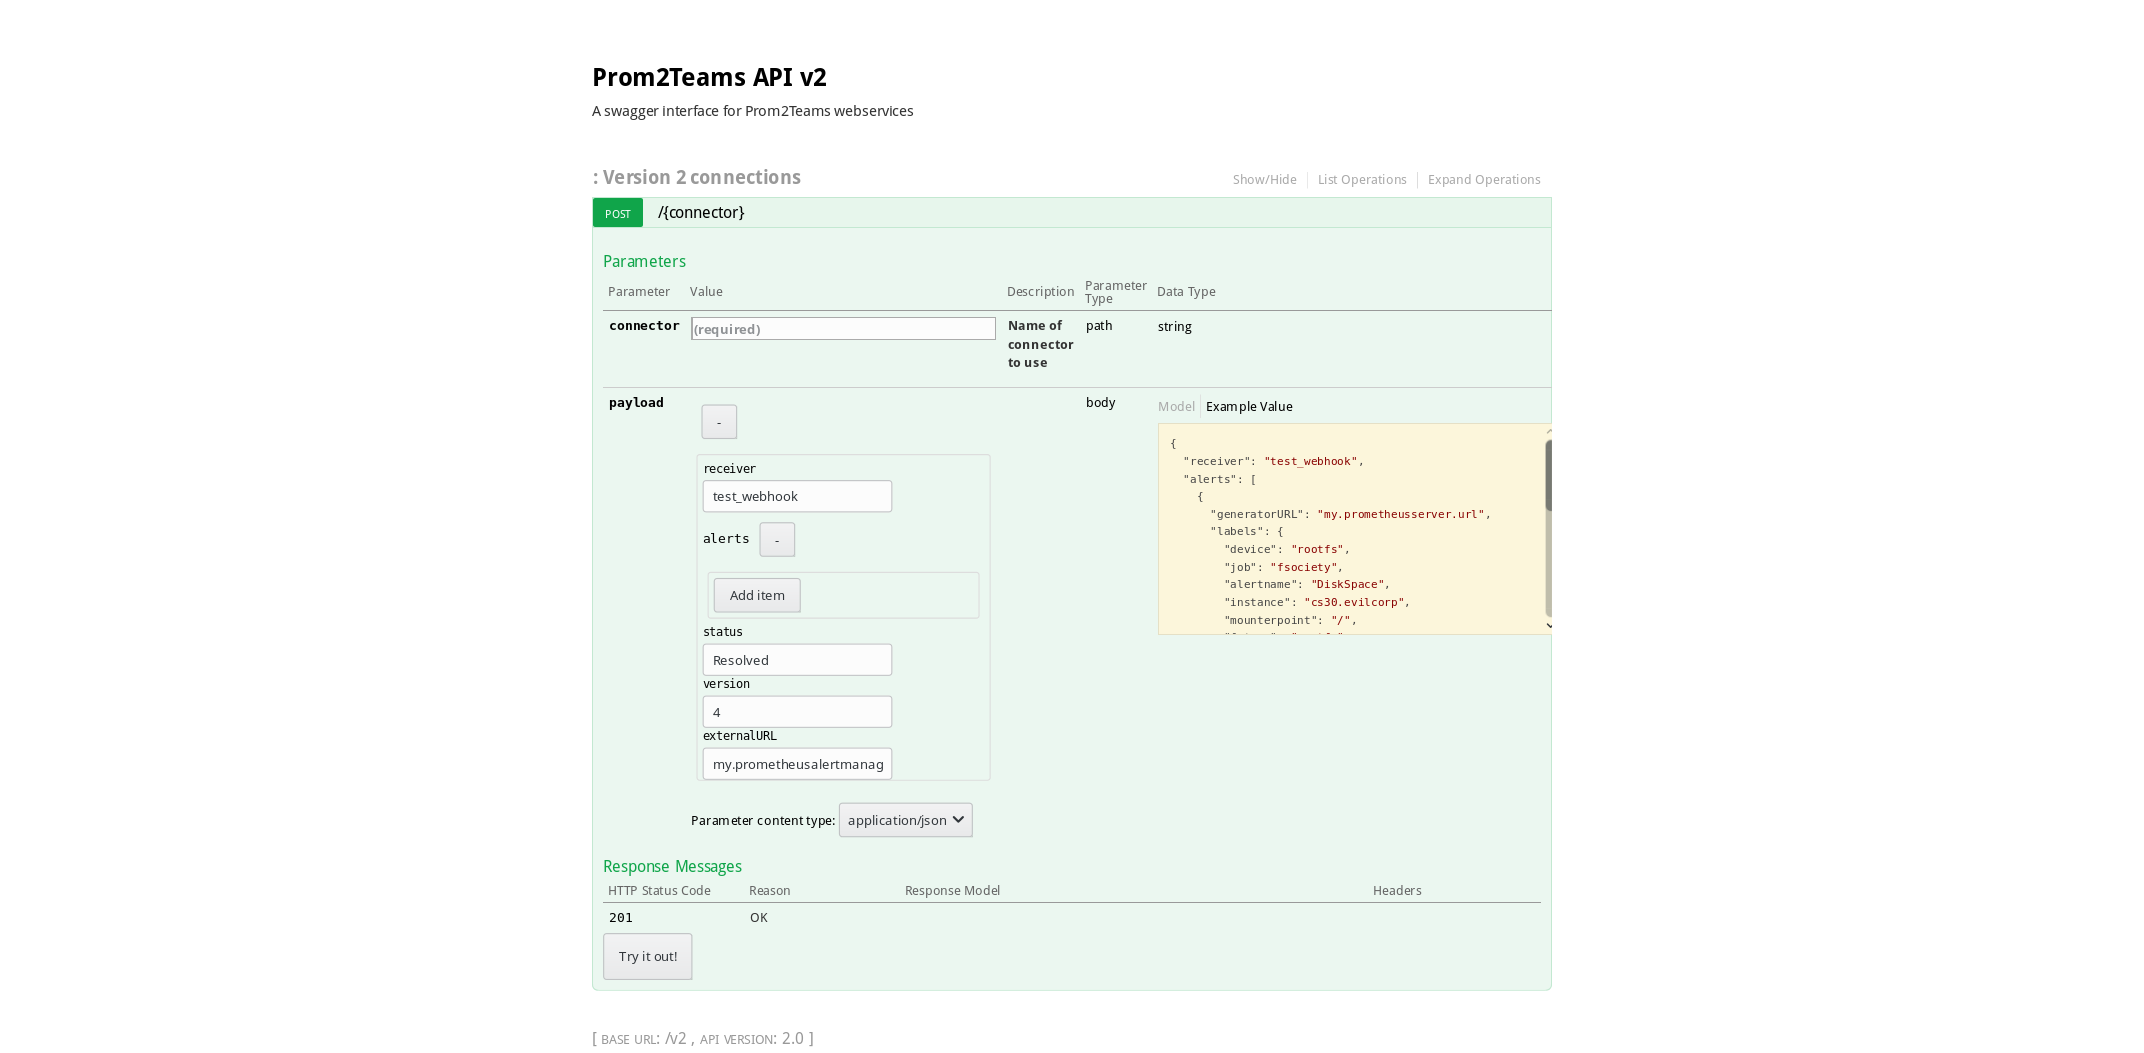
Note: In order to keep compatibility with previous versions, v2.0 keep attending the default connector ("Connector") in the endpoint 0.0.0.0:8089. This will be removed in future versions.
// The prom2teams endpoint to send HTTP POST requests to.
url: 0.0.0.0:8089/v2/<Connector1>
Prom2teams Prometheus metrics
Prom2teams uses Flask and, to have the service monitored, we use @rycus66's Prometheus Flask Exporter. This will enable an endpoint in /metrics where you could find interesting metrics to monitor such as number of responses with a certain status. To enable this endpoint, just either:
- Use the
--enablemetricsor-mflag when launching prom2teams. - Set the environment variable
PROM2TEAMS_PROMETHEUS_METRICS=true.
Templating
prom2teams provides a default template built with Jinja2 to render messages in Microsoft Teams. This template could be overrided using the 'templatepath' argument ('--templatepath ') during the application start.
Some fields are considered mandatory when received from Alert Manager. If such a field is not included a default value of 'unknown' is assigned.
All non-mandatory labels not in excluded list are injected in extra_labels key. All non-mandatory annotations not in excluded list are injected in extra_annotations key.
Alertmanager fingerprints are available in the fingerprint key. Fingerprints
are supported by Alertmanager 0.19.0 or greater.
Documentation
Swagger UI
Accessing to <Host>:<Port> (e.g. localhost:8089) in a web browser shows the API v1 documentation.
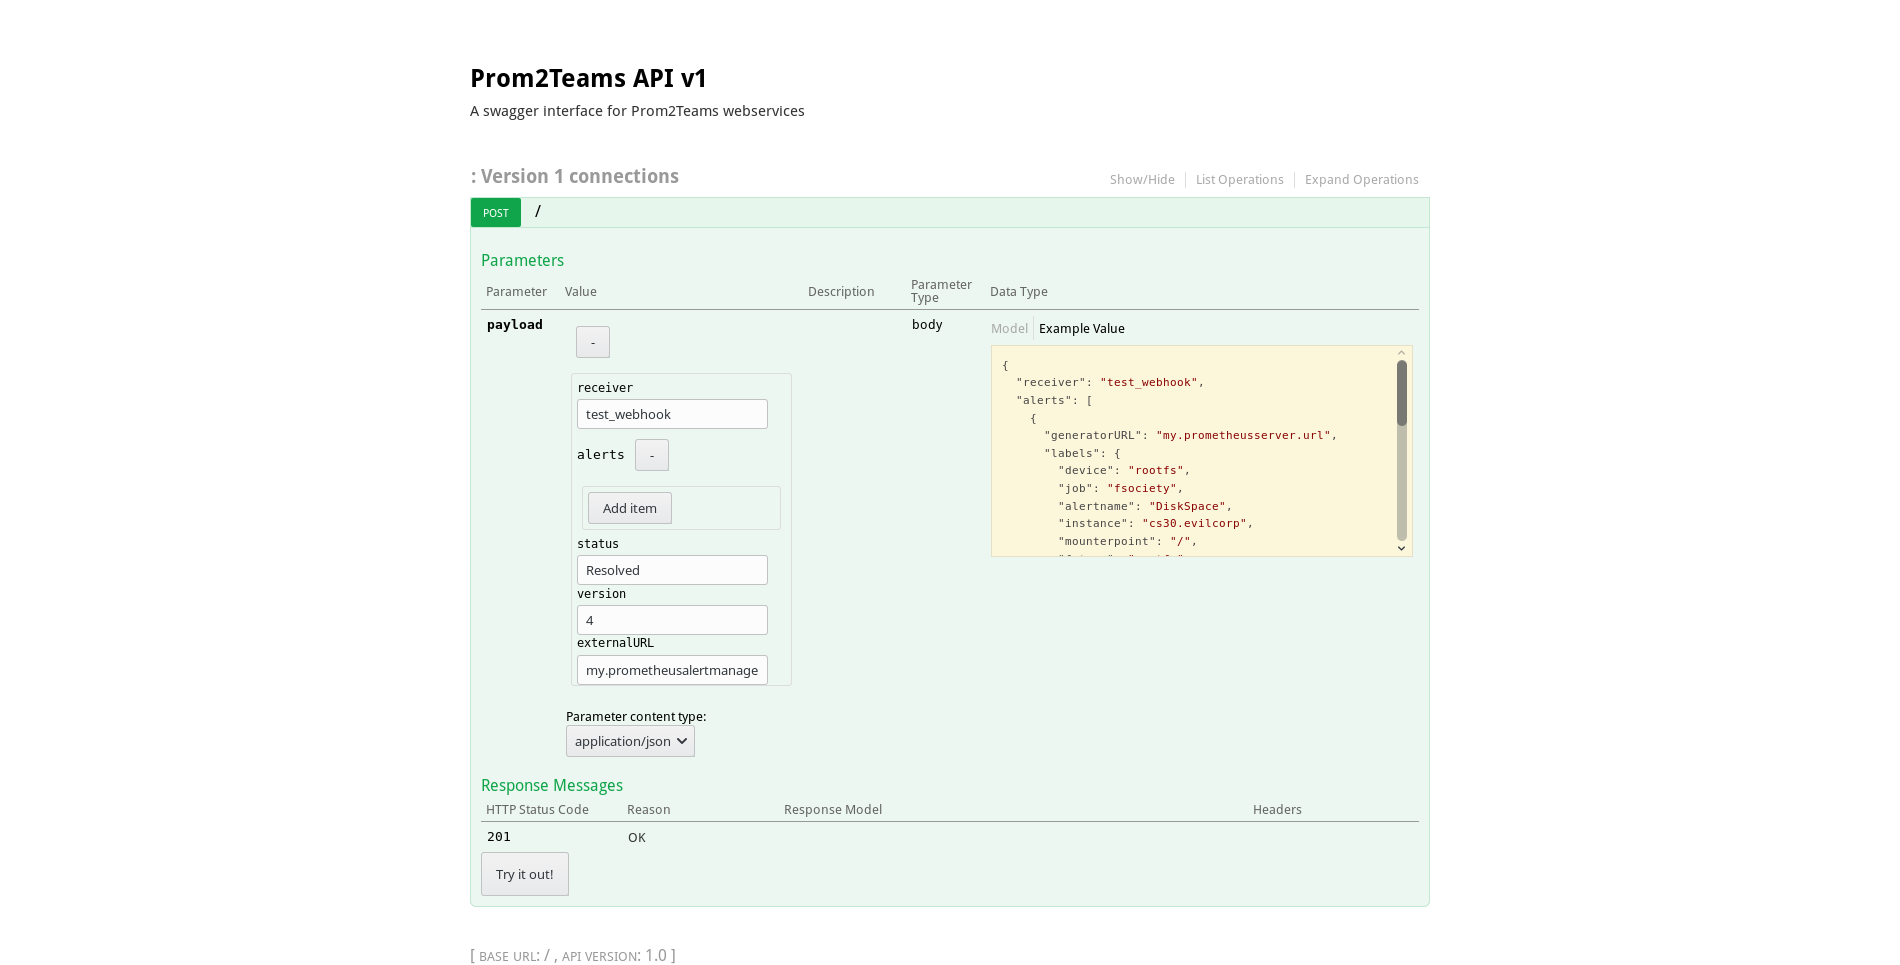
Accessing to <Host>:<Port>/v2 (e.g. localhost:8089/v2) in a web browser shows the API v2 documentation.
Testing
To run the test suite you should type the following:
// After cloning prom2teams :)
$ pip install -r requirements.txt
$ python3 -m unittest discover tests
$ cd tests/e2e
$ ./test.sh
Built With


Versioning
For the versions available, see the tags on this repository.
Additionaly you can see what change in each version in the CHANGELOG.md file.
Authors
- Idealista - Work with - idealista
See also the list of contributors who participated in this project.
License

This project is licensed under the Apache 2.0 license - see the LICENSE file for details.
Contributing
Please read CONTRIBUTING.md for details on our code of conduct, and the process for submitting pull requests to us.


