Merlion: A Machine Learning Framework for Time Series Intelligence


Project description


Merlion: A Machine Learning Library for Time Series
Table of Contents
- Introduction
- Comparison with Related Libraries
- Installation
- Documentation
- Getting Started
- Evaluation and Benchmarking
- Technical Report and Citing Merlion
Introduction
Merlion is a Python library for time series intelligence. It provides an end-to-end machine learning framework that includes loading and transforming data, building and training models, post-processing model outputs, and evaluating model performance. It supports various time series learning tasks, including forecasting, anomaly detection, and change point detection for both univariate and multivariate time series. This library aims to provide engineers and researchers a one-stop solution to rapidly develop models for their specific time series needs, and benchmark them across multiple time series datasets.
Merlion's key features are
- Standardized and easily extensible data loading & benchmarking for a wide range of forecasting and anomaly detection datasets. This includes transparent support for custom datasets.
- A library of diverse models for anomaly detection, forecasting, and change point detection, all unified under a shared interface. Models include classic statistical methods, tree ensembles, and deep learning approaches. Advanced users may fully configure each model as desired.
- Abstract
DefaultDetectorandDefaultForecastermodels that are efficient, robustly achieve good performance, and provide a starting point for new users. - AutoML for automated hyperaparameter tuning and model selection.
- Unified API for using a wide range of models to forecast with exogenous regressors.
- Practical, industry-inspired post-processing rules for anomaly detectors that make anomaly scores more interpretable, while also reducing the number of false positives.
- Easy-to-use ensembles that combine the outputs of multiple models to achieve more robust performance.
- Flexible evaluation pipelines that simulate the live deployment & re-training of a model in production, and evaluate performance on both forecasting and anomaly detection.
- Native support for visualizing model predictions, including with a clickable visual UI.
- Distributed computation backend using PySpark, which can be used to serve time series applications at industrial scale.
Comparison with Related Libraries
The table below provides a visual overview of how Merlion's key features compare to other libraries for time series anomaly detection and/or forecasting.
| Merlion | Prophet | Alibi Detect | Kats | darts | statsmodels | nixtla | GluonTS | RRCF | STUMPY | Greykite | pmdarima | |
|---|---|---|---|---|---|---|---|---|---|---|---|---|
| Univariate Forecasting | ✅ | ✅ | ✅ | ✅ | ✅ | ✅ | ✅ | ✅ | ✅ | |||
| Multivariate Forecasting | ✅ | ✅ | ✅ | ✅ | ✅ | ✅ | ||||||
| Univariate Anomaly Detection | ✅ | ✅ | ✅ | ✅ | ✅ | ✅ | ✅ | ✅ | ✅ | |||
| Multivariate Anomaly Detection | ✅ | ✅ | ✅ | ✅ | ✅ | ✅ | ||||||
| Pre Processing | ✅ | ✅ | ✅ | ✅ | ✅ | ✅ | ✅ | ✅ | ||||
| Post Processing | ✅ | ✅ | ||||||||||
| AutoML | ✅ | ✅ | ✅ | |||||||||
| Ensembles | ✅ | ✅ | ✅ | ✅ | ||||||||
| Benchmarking | ✅ | ✅ | ✅ | ✅ | ✅ | |||||||
| Visualization | ✅ | ✅ | ✅ | ✅ | ✅ |
The following features are new in Merlion 2.0:
| Merlion | Prophet | Alibi Detect | Kats | darts | statsmodels | nixtla | GluonTS | RRCF | STUMPY | Greykite | pmdarima | |
|---|---|---|---|---|---|---|---|---|---|---|---|---|
| Exogenous Regressors | ✅ | ✅ | ✅ | ✅ | ✅ | ✅ | ||||||
| Change Point Detection | ✅ | ✅ | ✅ | ✅ | ✅ | |||||||
| Clickable Visual UI | ✅ | |||||||||||
| Distributed Backend | ✅ | ✅ |
Installation
Merlion consists of two sub-repos: merlion implements the library's core time series intelligence features,
and ts_datasets provides standardized data loaders for multiple time series datasets. These loaders load
time series as pandas.DataFrame s with accompanying metadata.
You can install merlion from PyPI by calling pip install salesforce-merlion. You may install from source by
cloning this repoand calling pip install Merlion/, or pip install -e Merlion/ to install in editable mode.
You may install additional dependencies via pip install salesforce-merlion[all], or by calling
pip install "Merlion/[all]" if installing from source.
Individually, the optional dependencies include dashboard for a GUI dashboard,
spark for a distributed computation backend with PySpark, and deep-learning for all deep learning models.
To install the data loading package ts_datasets, clone this repo and call pip install -e Merlion/ts_datasets/.
This package must be installed in editable mode (i.e. with the -e flag) if you don't want to manually specify the
root directory of every dataset when initializing its data loader.
Note the following external dependencies:
-
Some of our forecasting models depend on OpenMP. If using
conda, pleaseconda install -c conda-forge lightgbmbefore installing our package. This will ensure that OpenMP is configured to work with thelightgbmpackage (one of our dependencies) in yourcondaenvironment. If using Mac, please install Homebrew and callbrew install libompso that the OpenMP libary is available for the model. -
Some of our anomaly detection models depend on the Java Development Kit (JDK). For Ubuntu, call
sudo apt-get install openjdk-11-jdk. For Mac OS, install Homebrew and callbrew tap adoptopenjdk/openjdk && brew install --cask adoptopenjdk11. Also ensure thatjavacan be found on yourPATH, and that theJAVA_HOMEenvironment variable is set.
Documentation
For example code and an introduction to Merlion, see the Jupyter notebooks in
examples, and the guided walkthrough
here. You may find detailed API documentation (including the
example code) here. The
technical report outlines Merlion's overall architecture
and presents experimental results on time series anomaly detection & forecasting for both univariate and multivariate
time series.
Getting Started
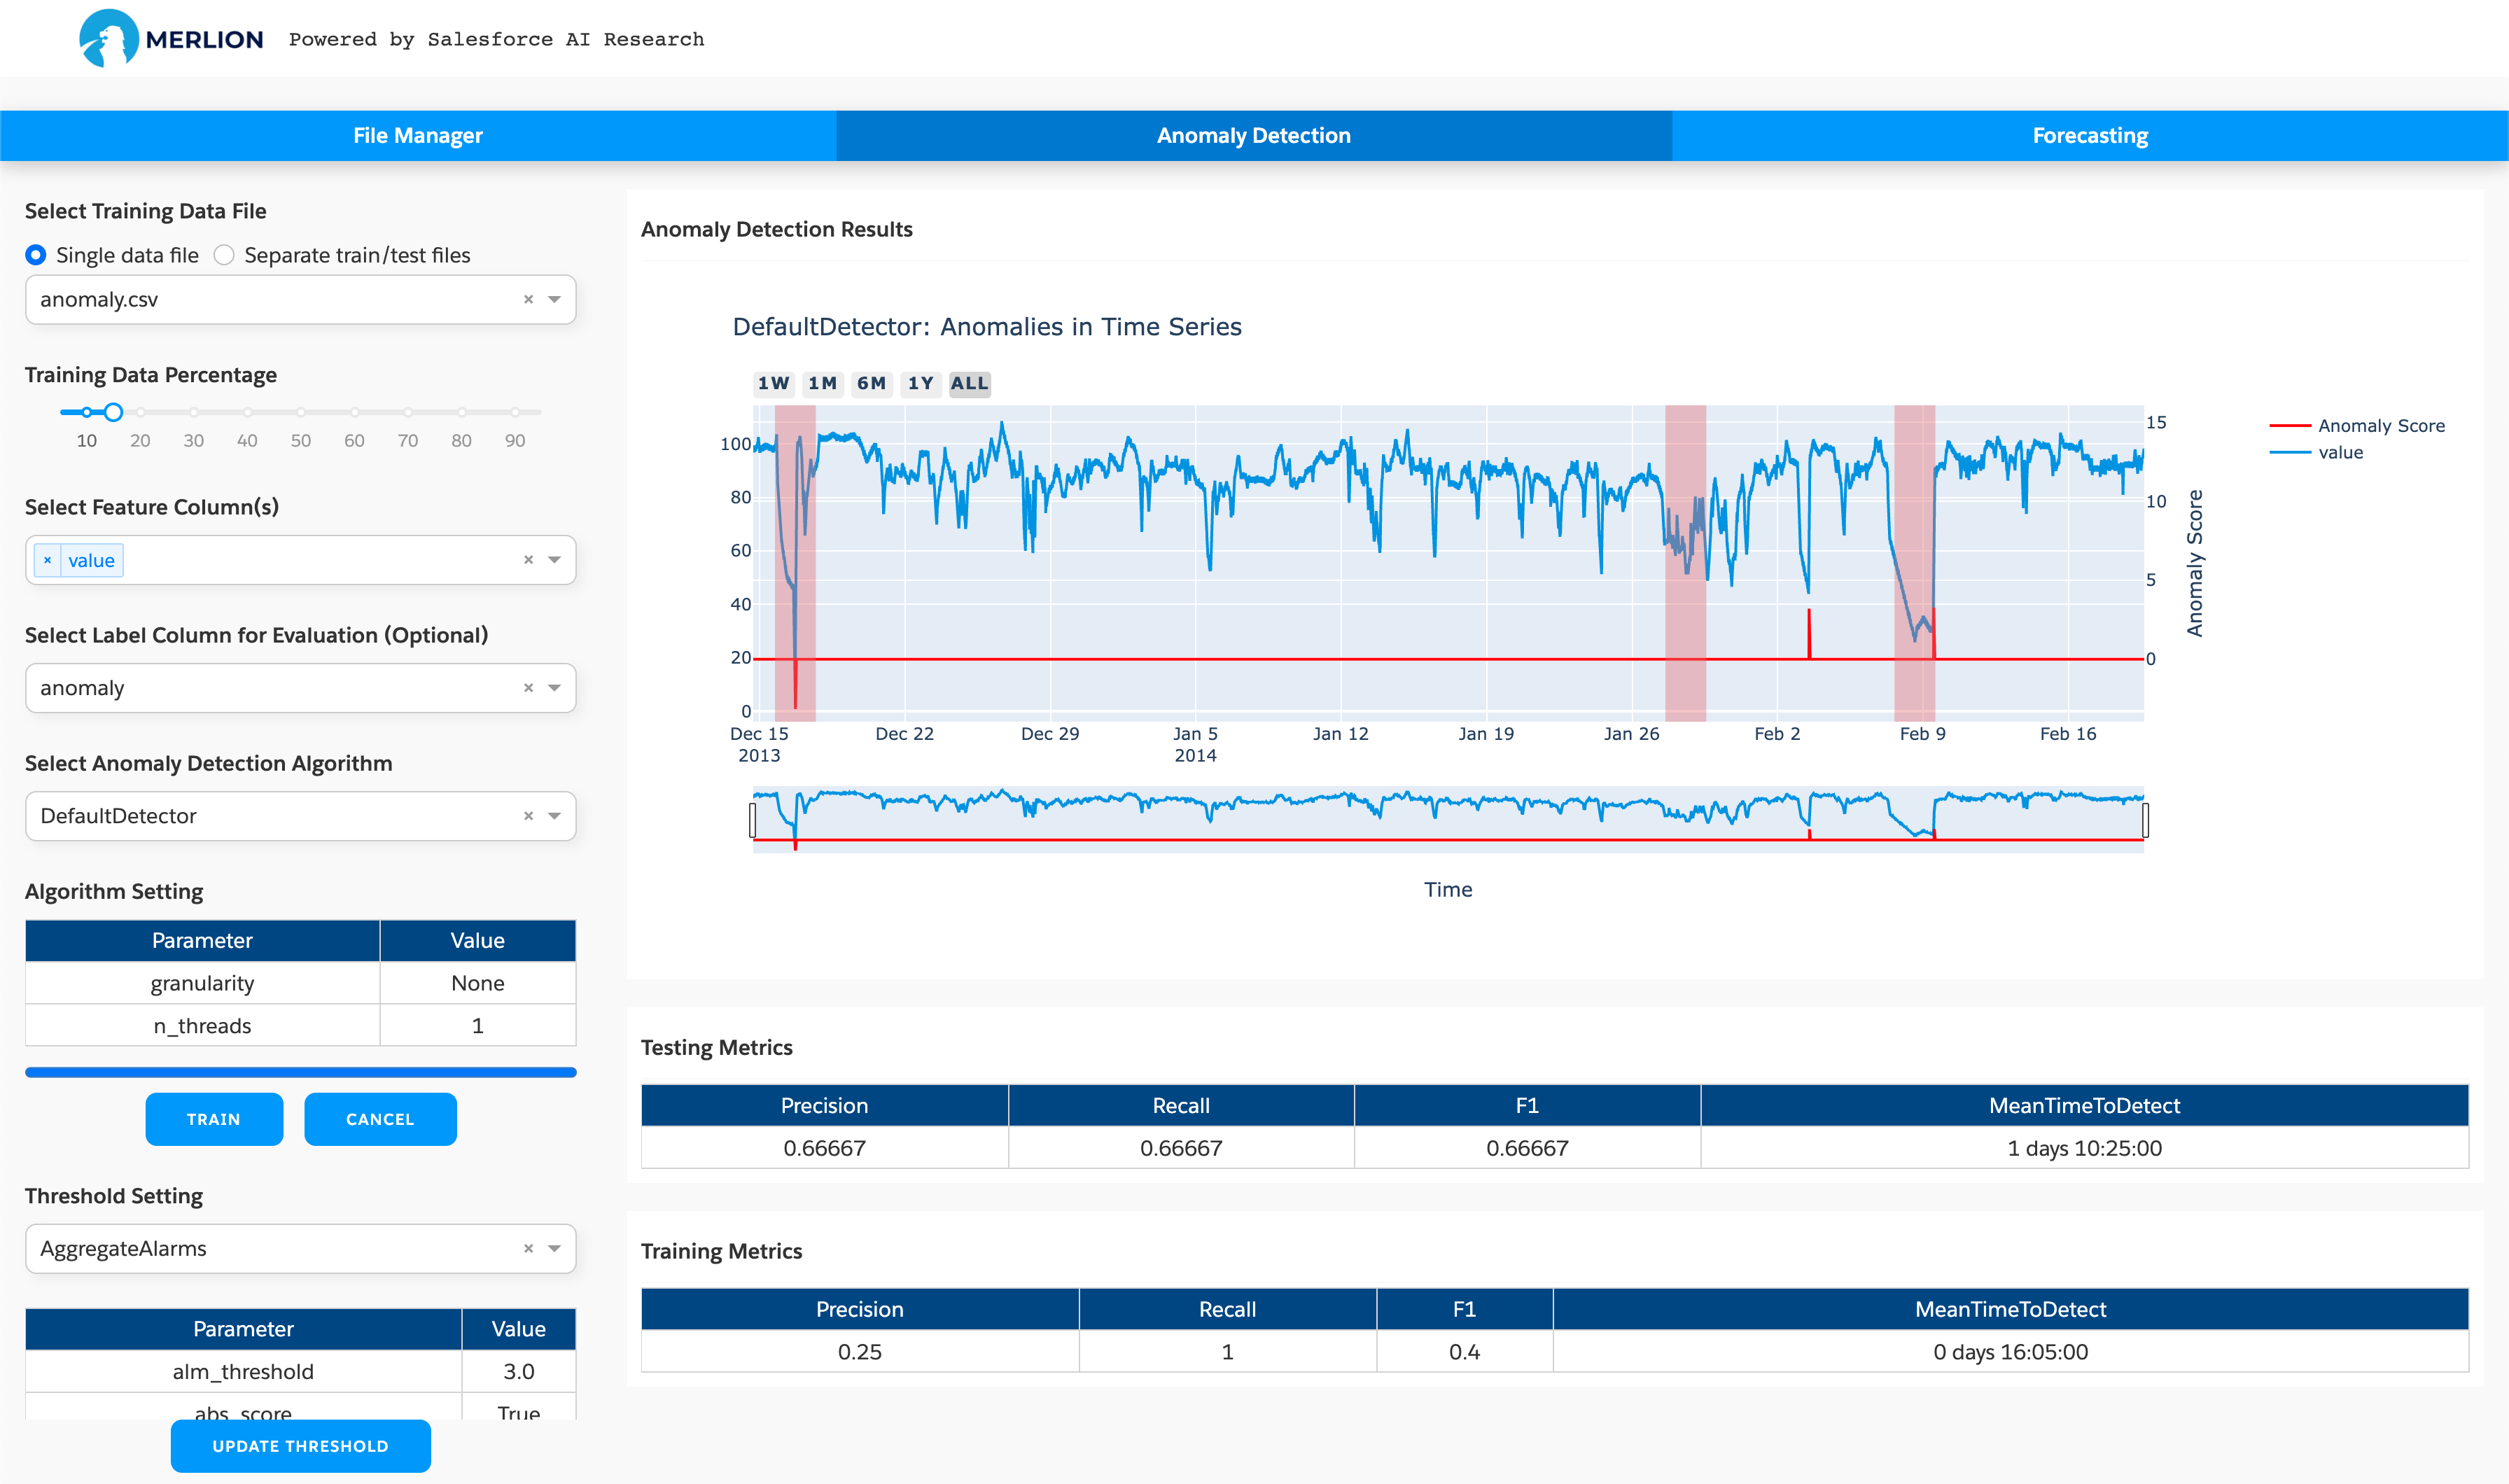
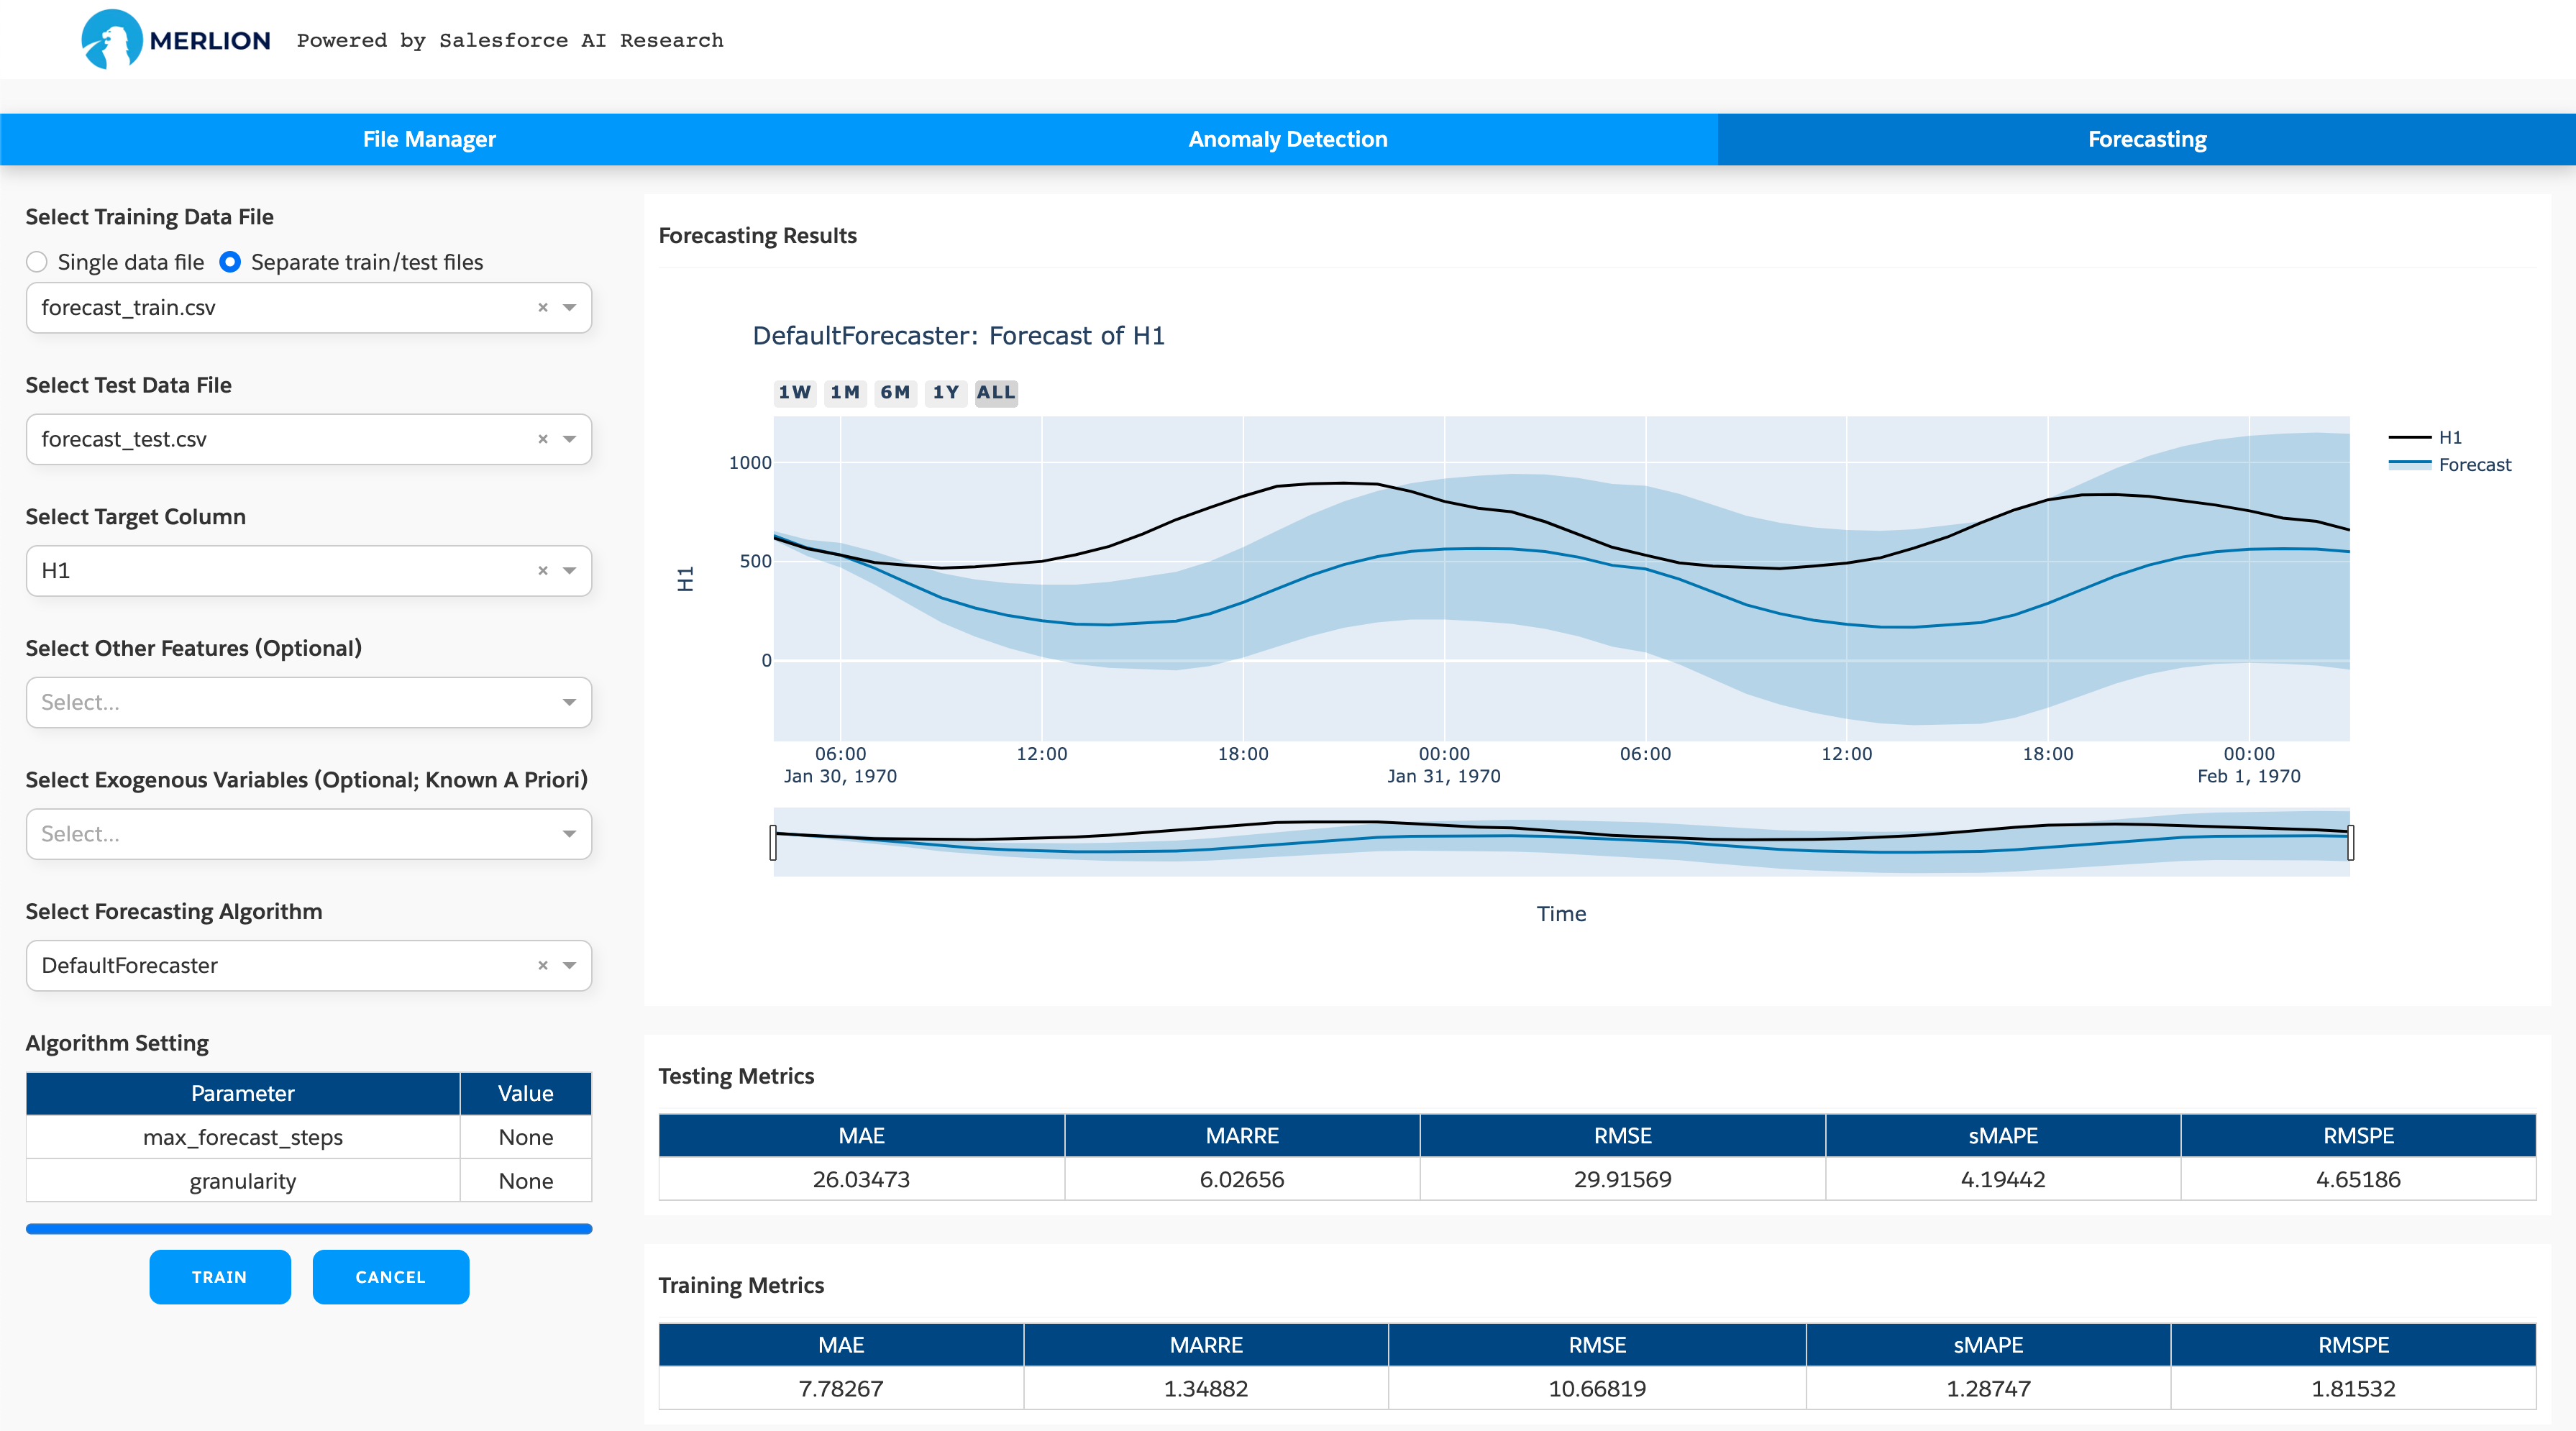
The easiest way to get started is to use the GUI web-based
dashboard.
This dashboard provides a great way to quickly experiment with many models on your own custom datasets.
To use it, install Merlion with the optional dashboard dependency (i.e.
pip install salesforce-merlion[dashboard]), and call python -m merlion.dashboard from the command line.
You can view the dashboard at http://localhost:8050.
Below, we show some screenshots of the dashboard for both anomaly detection and forecasting.
To help you get started with using Merlion in your own code, we provide below some minimal examples using Merlion default models for both anomaly detection and forecasting.
Anomaly Detection
Here, we show the code to replicate the results from the anomaly detection dashboard above.
We begin by importing Merlion’s TimeSeries class and the data loader for the Numenta Anomaly Benchmark NAB.
We can then divide a specific time series from this dataset into training and testing splits.
from merlion.utils import TimeSeries
from ts_datasets.anomaly import NAB

# Data loader returns pandas DataFrames, which we convert to Merlion TimeSeries
time_series, metadata = NAB(subset="realKnownCause")[3]
train_data = TimeSeries.from_pd(time_series[metadata.trainval])
test_data = TimeSeries.from_pd(time_series[~metadata.trainval])
test_labels = TimeSeries.from_pd(metadata.anomaly[~metadata.trainval])
We can then initialize and train Merlion’s DefaultDetector, which is an anomaly detection model that
balances performance with efficiency. We also obtain its predictions on the test split.
from merlion.models.defaults import DefaultDetectorConfig, DefaultDetector
model = DefaultDetector(DefaultDetectorConfig())
model.train(train_data=train_data)
test_pred = model.get_anomaly_label(time_series=test_data)
Next, we visualize the model's predictions.
from merlion.plot import plot_anoms
import matplotlib.pyplot as plt
fig, ax = model.plot_anomaly(time_series=test_data)
plot_anoms(ax=ax, anomaly_labels=test_labels)
plt.show()
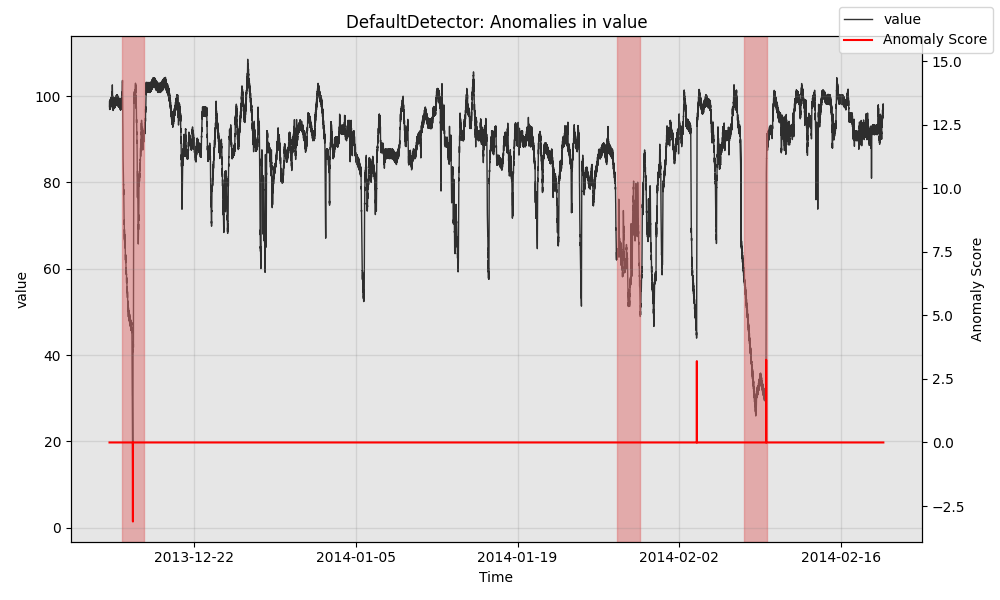
Finally, we can quantitatively evaluate the model. The precision and recall come from the fact that the model fired 3 alarms, with 2 true positives, 1 false negative, and 1 false positive. We also evaluate the mean time the model took to detect each anomaly that it correctly detected.
from merlion.evaluate.anomaly import TSADMetric
p = TSADMetric.Precision.value(ground_truth=test_labels, predict=test_pred)
r = TSADMetric.Recall.value(ground_truth=test_labels, predict=test_pred)
f1 = TSADMetric.F1.value(ground_truth=test_labels, predict=test_pred)
mttd = TSADMetric.MeanTimeToDetect.value(ground_truth=test_labels, predict=test_pred)
print(f"Precision: {p:.4f}, Recall: {r:.4f}, F1: {f1:.4f}\n"
      f"Mean Time To Detect: {mttd}")
Precision: 0.6667, Recall: 0.6667, F1: 0.6667
Mean Time To Detect: 1 days 10:22:30
Forecasting
Here, we show the code to replicate the results from the forecasting dashboard above.
We begin by importing Merlion’s TimeSeries class and the data loader for the M4 dataset. We can then divide a
specific time series from this dataset into training and testing splits.
from merlion.utils import TimeSeries
from ts_datasets.forecast import M4

# Data loader returns pandas DataFrames, which we convert to Merlion TimeSeries
time_series, metadata = M4(subset="Hourly")[0]
train_data = TimeSeries.from_pd(time_series[metadata.trainval])
test_data = TimeSeries.from_pd(time_series[~metadata.trainval])
We can then initialize and train Merlion’s DefaultForecaster, which is an forecasting model that balances
performance with efficiency. We also obtain its predictions on the test split.
from merlion.models.defaults import DefaultForecasterConfig, DefaultForecaster
model = DefaultForecaster(DefaultForecasterConfig())
model.train(train_data=train_data)
test_pred, test_err = model.forecast(time_stamps=test_data.time_stamps)
Next, we visualize the model’s predictions.
import matplotlib.pyplot as plt
fig, ax = model.plot_forecast(time_series=test_data, plot_forecast_uncertainty=True)
plt.show()
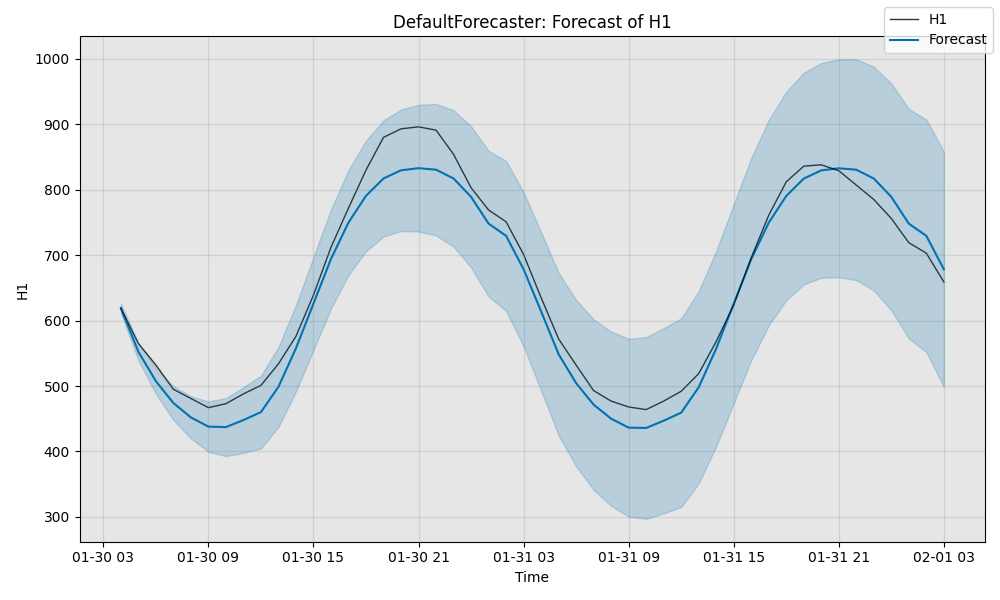
Finally, we quantitatively evaluate the model. sMAPE measures the error of the prediction on a scale of 0 to 100 (lower is better), while MSIS evaluates the quality of the 95% confidence band on a scale of 0 to 100 (lower is better).
# Evaluate the model's predictions quantitatively
from scipy.stats import norm
from merlion.evaluate.forecast import ForecastMetric

# Compute the sMAPE of the predictions (0 to 100, smaller is better)
smape = ForecastMetric.sMAPE.value(ground_truth=test_data, predict=test_pred)

# Compute the MSIS of the model's 95% confidence interval (0 to 100, smaller is better)
lb = TimeSeries.from_pd(test_pred.to_pd() + norm.ppf(0.025) * test_err.to_pd().values)
ub = TimeSeries.from_pd(test_pred.to_pd() + norm.ppf(0.975) * test_err.to_pd().values)
msis = ForecastMetric.MSIS.value(ground_truth=test_data, predict=test_pred,
                                 insample=train_data, lb=lb, ub=ub)
print(f"sMAPE: {smape:.4f}, MSIS: {msis:.4f}")
sMAPE: 4.1944, MSIS: 18.9331
Evaluation and Benchmarking
One of Merlion's key features is an evaluation pipeline that simulates the live deployment of a model on historical data. This enables you to compare models on the datasets relevant to them, under the conditions that they may encounter in a production environment. Our evaluation pipeline proceeds as follows:
- Train an initial model on recent historical training data (designated as the training split of the time series)
- At a regular interval (e.g. once per day), retrain the entire model on the most recent data. This can be either the entire history of the time series, or a more limited window (e.g. 4 weeks).
- Obtain the model's predictions (anomaly scores or forecasts) for the time series values that occur between re-trainings. You may customize whether this should be done in batch (predicting all values at once), streaming (updating the model's internal state after each data point without fully re-training it), or some intermediate cadence.
- Compare the model's predictions against the ground truth (labeled anomalies for anomaly detection, or the actual time series values for forecasting), and report quantitative evaluation metrics.
We provide scripts that allow you to use this pipeline to evaluate arbitrary models on arbitrary datasets. For example, invoking
python benchmark_anomaly.py --dataset NAB_realAWSCloudwatch --model IsolationForest --retrain_freq 1d
will evaluate the anomaly detection performance of the IsolationForest (retrained once a day) on the
"realAWSCloudwatch" subset of the NAB dataset. Similarly, invoking
python benchmark_forecast.py --dataset M4_Hourly --model ETS
will evaluate the batch forecasting performance (i.e. no retraining) of ETS on the "Hourly" subset of the M4 dataset.
You can find the results produced by running these scripts in the Experiments section of the
technical report.
Technical Report and Citing Merlion
You can find more details in our technical report: https://arxiv.org/abs/2109.09265
If you're using Merlion in your research or applications, please cite using this BibTeX:
@article{bhatnagar2021merlion,
      title={Merlion: A Machine Learning Library for Time Series},
      author={Aadyot Bhatnagar and Paul Kassianik and Chenghao Liu and Tian Lan and Wenzhuo Yang
              and Rowan Cassius and Doyen Sahoo and Devansh Arpit and Sri Subramanian and Gerald Woo
              and Amrita Saha and Arun Kumar Jagota and Gokulakrishnan Gopalakrishnan and Manpreet Singh
              and K C Krithika and Sukumar Maddineni and Daeki Cho and Bo Zong and Yingbo Zhou
              and Caiming Xiong and Silvio Savarese and Steven Hoi and Huan Wang},
      year={2021},
      eprint={2109.09265},
      archivePrefix={arXiv},
      primaryClass={cs.LG}
}
To Dos
We are striving to leverage the time-series modeling with GPUs to further improve the speed and throughput of Merlion. Stay tuned ...


