Browser-based GUI HDF Viewer in Python

Project description
BroH5
(Bro)wser-based GUI (H)DF(5) Viewer in Python
Web browser-based GUI software is increasingly popular for its cross-platform compatibility, but typically requires web programming knowledge.
The Nicegui framework simplifies this, enabling pure Python development of browser-based GUIs. This project uses Nicegui to create an HDF viewer, showcasing its effectiveness for local app development. Unlike other apps such as Hdfviewer, Vitables, Nexpy, or H5web, which are built using C, Java, Qt/PyQt, or HTML/JavaScript; this project is unique in being a browser-based GUI, but written entirely in Python with a minimal codebase.
Features
-
A browser-based GUI software for viewing HDF (Hierarchical Data Format) file written in pure Python with minimal codebase.
-
The software provides essential tools for viewing hdf files such as: displaying tree structures or paths to datasets/groups; and presenting datasets as values, images, plots, or tables. Users also can save datasets to images or csv formats.
-
Broh5 can view compressed hdf files by using compressors from hdf5plugin.
-
The codebase is designed using the RUI (Rendering-Utilities-Interactions) concept, which is known as the MVC (Model-View-Controller) pattern in the GUI development community. The name 'MVC' may not be very intuitive for those new to GUI development. However, this design allows for the development of complex software and makes it easier to extend its capabilities.
Installation
Broh5 can be installed using pip, conda, or directly from the source. Users can also generate a standalone executable file for convenient usage. Details are at:
Documentation
Documentation page is at: https://broh5.readthedocs.io. Brief functionalities of broh5:
- Users can open a hdf file by clicking the "Select file" button. Multiple hdf files can be opened sequentially.
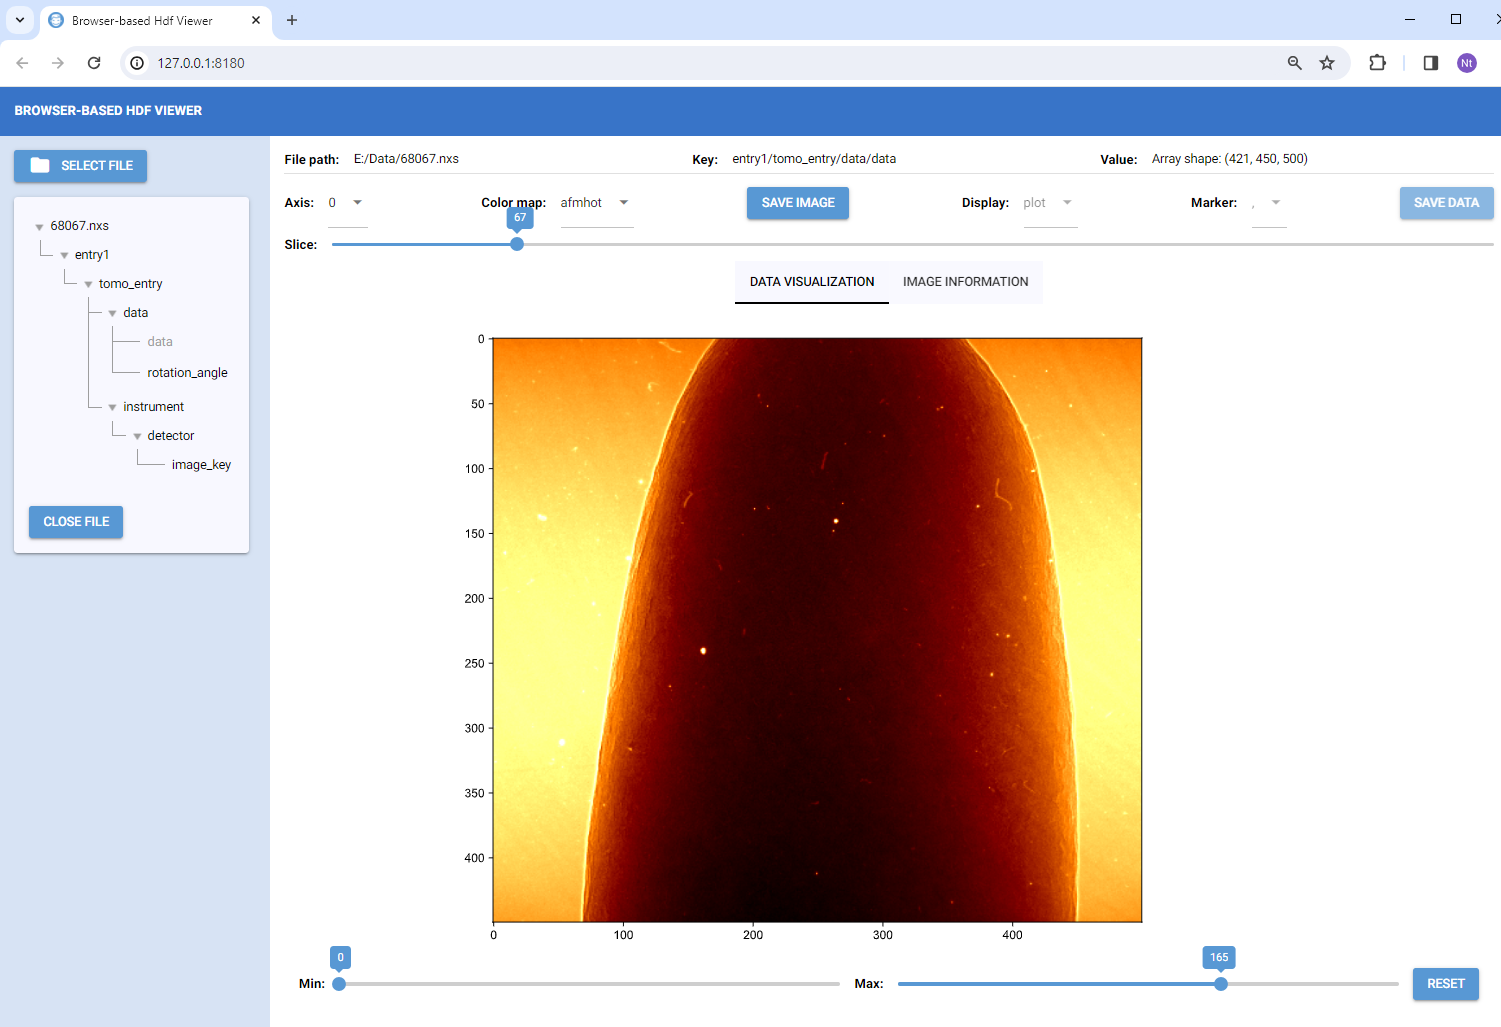
- Upon opening, the tree structure of the current hdf file is displayed, allowing users to navigate different branches (hdf groups) or leaves (hdf datasets). The path to datasets/groups is also displayed. If a dataset contains a string or a single float/integer value, it will be shown.
- If dataset is a 3D array, it's presented as an image. Users can slice through various images and adjust the contrast. Slicing is available for different axes; however, for large datasets, slicing along axis 2 is disabled due to processing time.
- Datasets that are 1D or 2D arrays will be shown as plots or tables, selectively.
- Users have the option to save images or tables to disk.
Update notes
- 30/10/2023: Publish codes, deploy on pip and conda.
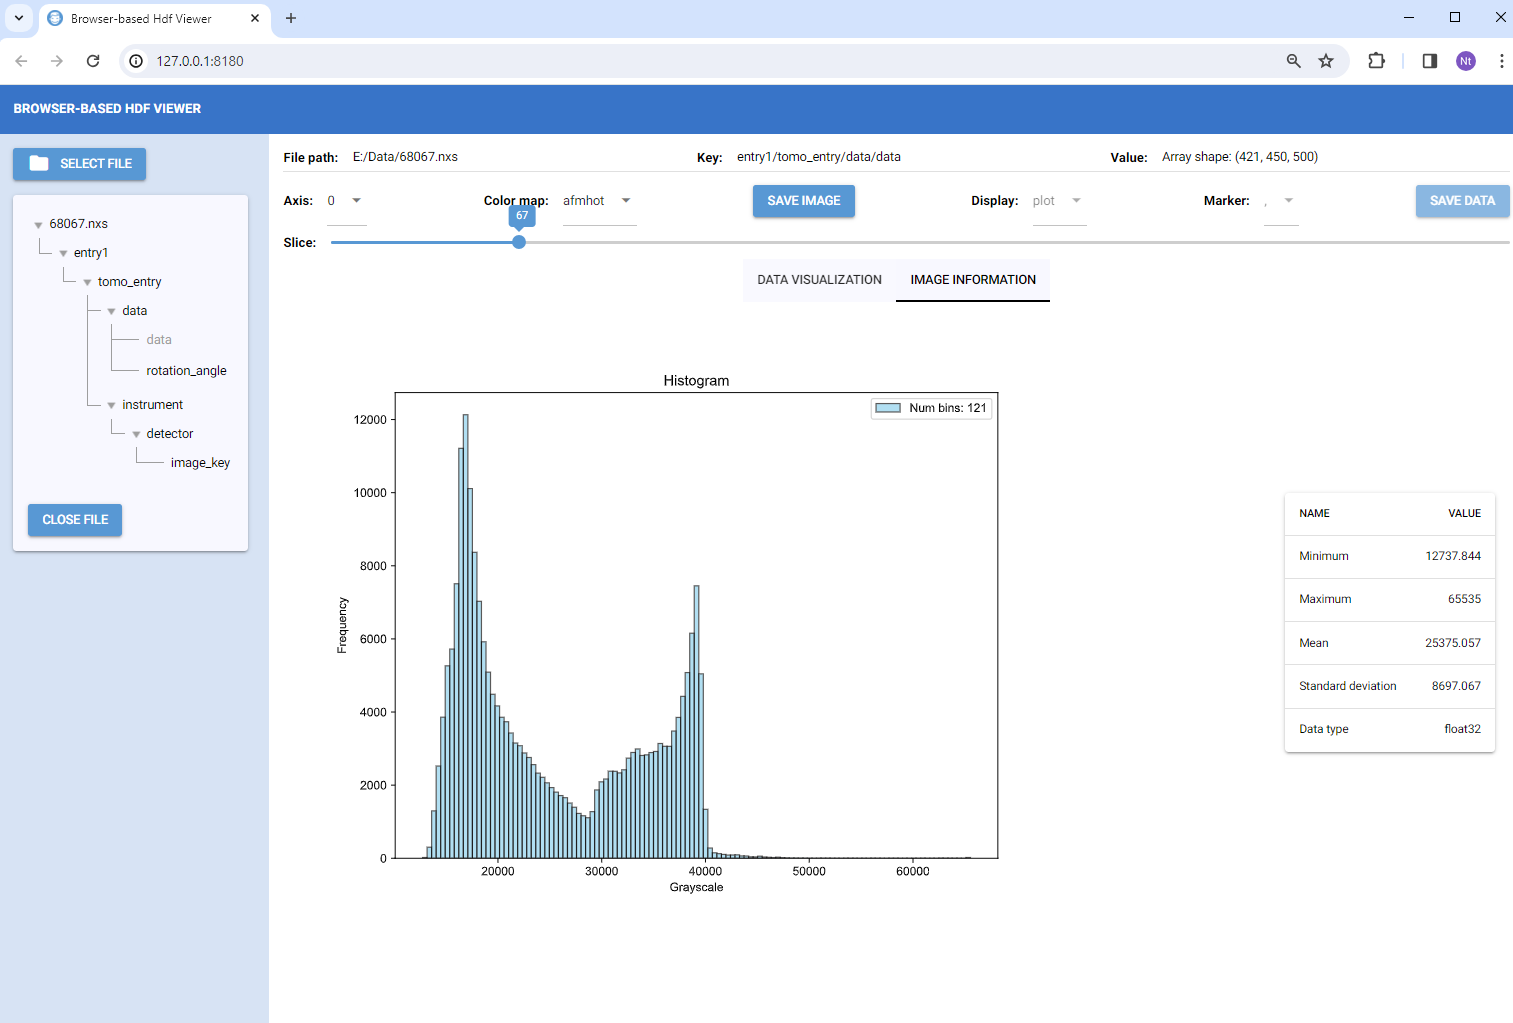
- 11/02/2024: Add tab for displaying image histogram and statistical information.
- 30/04/2024: Allow to open/save from the last opened folder.
Author
Nghia T. Vo - NSLS-II, Brookhaven National Lab, USA.


Download files
Download the file for your platform. If you're not sure which to choose, learn more about installing packages.


