Browser-based GUI HDF Viewer in Python

Project description
BroH5
(Bro)wser-based GUI (H)DF(5) Viewer in Python
Using web browsers to build GUI (Graphical User Interface) software is becoming increasingly popular due to its ability to run across multiple OS with ease. However, developers usually need to know web programming.
Fortunately, Python libraries like the Nicegui framework make it simpler, allowing developers to create browser-based GUIs using pure Python. This project uses Nicegui to develop an HDF viewer, demonstrating its potential for writing local apps. While various GUI software options exist for viewing hdf/h5/nxs files; such as hdfviewer, vitables, nexpy, or h5web developed in languages like C, Java, Qt/PyQt, or Html/JavasSript; this is a pioneering project where the HDF viewer is web browser-based but written entirely in Python.
Features
-
A browser-based GUI software for viewing HDF (Hierarchical Data Format) file written in pure Python with minimal codebase.
-
The software provides essential tools for viewing hdf files such as: displaying tree structures or paths to datasets/groups; and presenting datasets as values, images, plots, or tables. Users also can save datasets to images or csv formats.
-
The codebase is designed using the RUI (Rendering-Utilities-Interactions) concept, which is known as the MVC (Model-View-Controller) pattern in the GUI development community. The name 'MVC' may not be very intuitive for those new to GUI development. However, this design allows for the development of complex software and makes it easier to extend its capabilities. To make things easier for beginners, a monolithic approach to the codebase is also provided for comparison.
Installation
-
Broh5 can be installed using
pip:pip install broh5
If using
conda:conda install -c algotom broh5
Once installed, launching Broh5 with:
broh5
-
To install broh5 from source using Conda:
-
Set up a conda environment:
First, ensure that you have Conda installed. If not, install Miniconda or Anaconda.
Create a new Conda environment. This ensures that any dependencies don't interfere with your current Python projects. You can name it whatever you like, but for this example, we'll call it broh5
conda create -n broh5 python=3.9
conda activate broh5
-
Clone the Repository:
Use git to clone the broh5 repository:
git clone https://github.com/nghia-vo/broh5.git broh5
Navigate to the cloned directory:
cd broh5
-
Install the software:
Using setup.py file by
python setup.py install
or pip
pip install .
-
If you would like to creating a standalone executable for broh5:
Install PyInstaller
pip install pyinstaller
Generate the executable file by running generate_exe.py at the cloned directory
python generate_exe.py
Navigate to the dist directory and run
./broh5.exe
the generated file can be moved to another location for more convenient usage.
-
Documentation
As a GUI-based software, broh5 is designed to be intuitive. Within the codebase, the naming conventions for modules and functions, as well as their organization, are self-explanatory. For those unfamiliar with NiceGui or the MVC design pattern, starting with the monolithic codebase is recommended.
Brief functionalities of broh5:
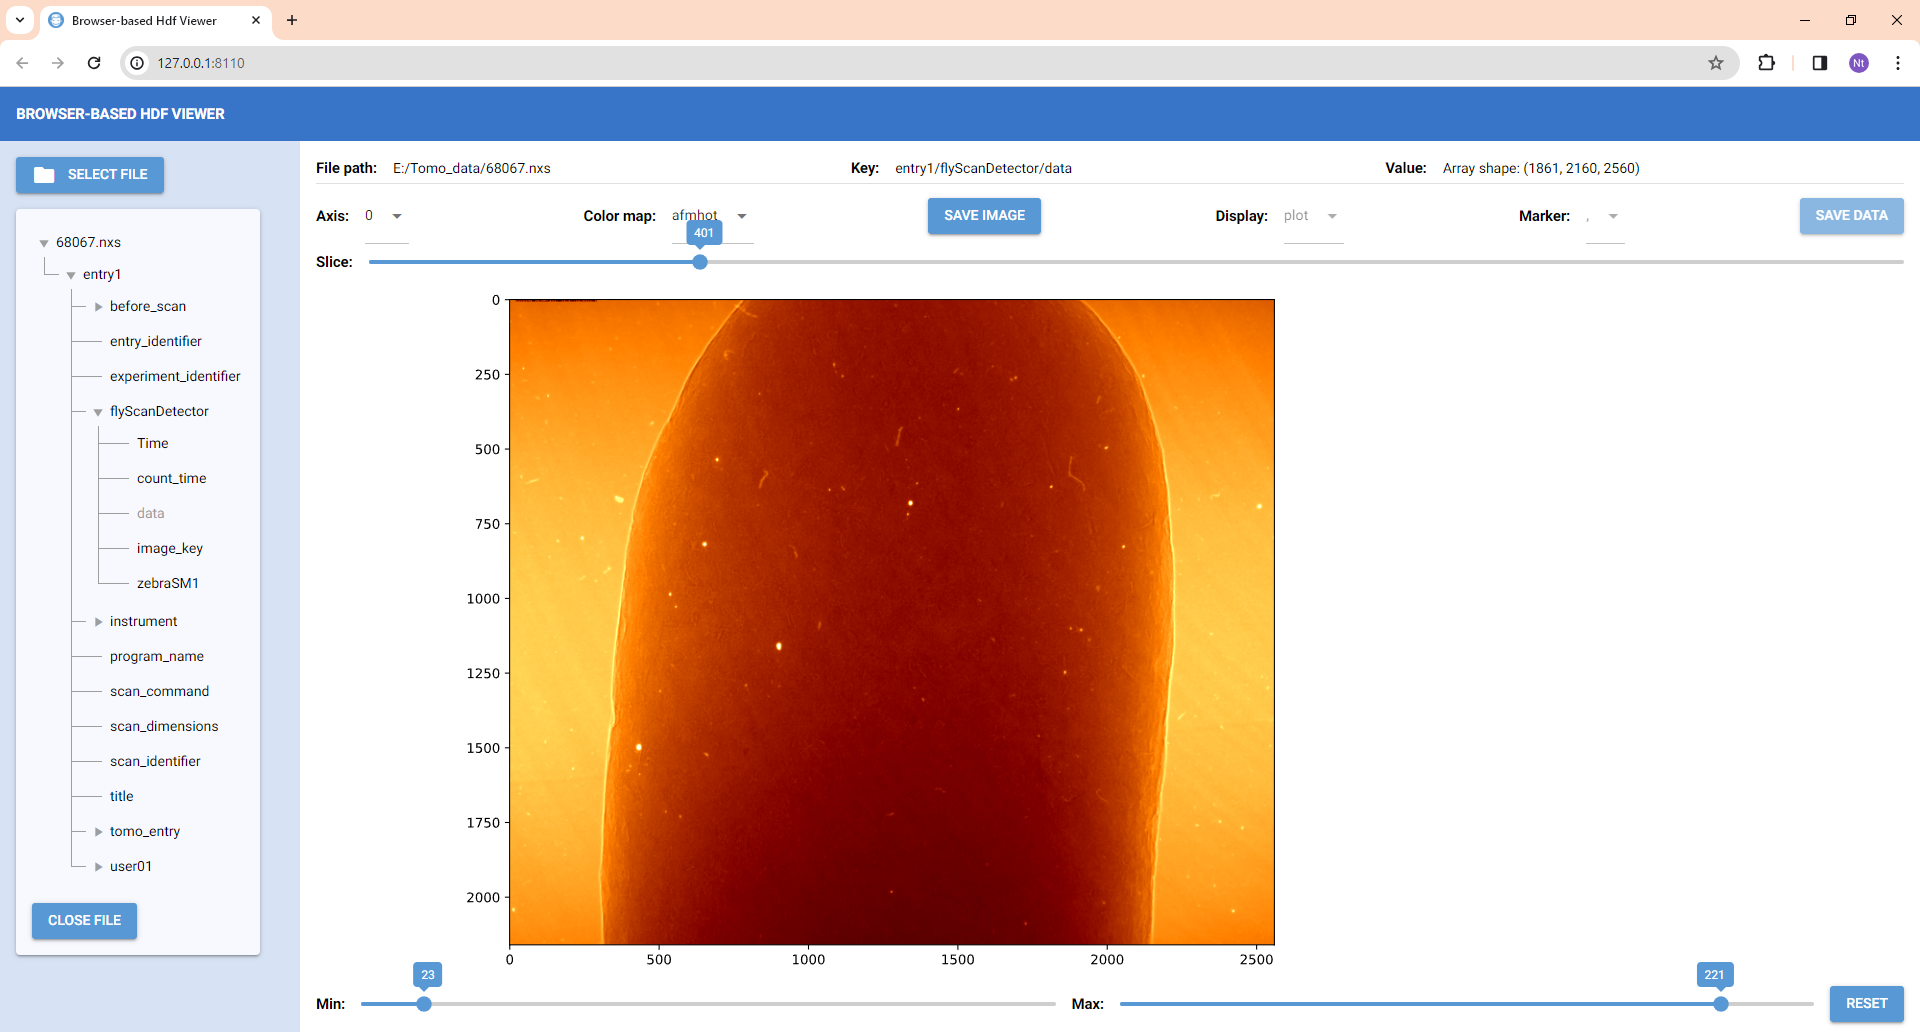
- Users can open an hdf file by clicking the "Select file" button. Multiple hdf files can be opened sequentially.
- Upon opening, the tree structure of the current hdf file is displayed, allowing users to navigate different branches (hdf groups) or leaves (hdf datasets). The path to datasets/groups is also displayed. If a dataset contains a string or a single float/integer value, it will be shown.
- If dataset is a 3D array, it's presented as an image. Users can slice through various images and adjust the contrast. Slicing is available for different axes; however, for large datasets, slicing along axis 2 is disabled due to processing time.
- Datasets that are 1D or 2D arrays will be shown as plots or tables, selectively.
- Users have the option to save images or tables to disk.
Video demonstration:
Author
Nghia T. Vo - NSLS-II, Brookhaven National Lab, USA.


Download files
Download the file for your platform. If you're not sure which to choose, learn more about installing packages.


