Visualization tool for FElupe

Project description
FEplot
A visualization tool for FElupe.
FEplot is based on the polpular visualization library matplotlib which is used generally to create 2D plots. The fantastic thing that comes with FEplot is that matplotlib becomes able to plot 3D FEA results and I mean volume results not surfaces.
Setup
To run this project, you can easily install it locally using pip:
pip install feplot
All is ready now, let's move on!
How to Use
Starting with a 2D case:
import felupe as fem
from feplot.pylab import Plotter
# 2D Mesh case
# Get some data to plot
# Create mesh
mesh = fem.Rectangle(b=(10,10), n=20)
# Create region
region = fem.RegionQuad(mesh)
# Create field
field = fem.FieldsMixed(region, n=1)
# Create material
material = fem.NeoHooke(mu=1, bulk=1)
# Create solidbody
solid = fem.SolidBody(material, field)
# Set boundaries conditions (uniaxial test)
boundaries, _ = fem.dof.uniaxial(field,right=10, clamped=True)
# Define displacement amplitude
move = fem.math.linsteps([0,15],5)
ramp = {boundaries['move']:move}
# Create step
step = fem.Step([solid], ramp, boundaries)
# Create job and burn it!
job = fem.Job([step])
job.evaluate(verbose=False)
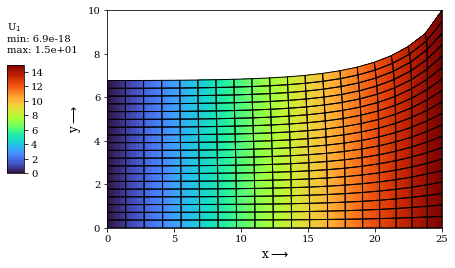
# Plot displacements along x-axis
pl = Plotter()
pl.plot_displacement(field, label='U$_1$', component=0, show_mesh=True, deformed=True,
show_min_max=True)
You will get this 👇
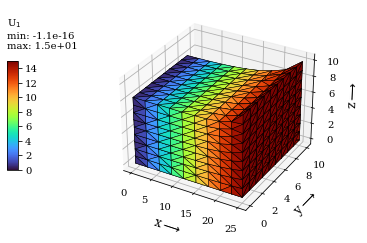
For the 3D case, just we will replace the mesh and the region definitions. Then, we have:
# Create mesh
mesh = fem.Cube(b=(10,10,10), n=10)
# Create region
region = fem.RegionHexahedron(mesh)
After running your code, you will get this 👇
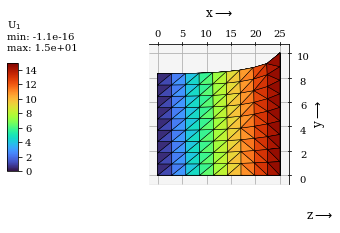
You can choose a specified view plane, for e.g. : the XY plane, simply add the following line:
pl.xy_view()
The result should be like this 👇
License
FEplot - A visualization tool for FElupe (C) 2022 Mohamed ZAARAOUI, Tunisia.
This program is free software: you can redistribute it and/or modify it under the terms of the GNU General Public License as published by the Free Software Foundation, either version 3 of the License, or (at your option) any later version.
This program is distributed in the hope that it will be useful, but WITHOUT ANY WARRANTY; without even the implied warranty of MERCHANTABILITY or FITNESS FOR A PARTICULAR PURPOSE. See the GNU General Public License for more details.
You should have received a copy of the GNU General Public License along with this program. If not, see https://www.gnu.org/licenses/.


Download files
Download the file for your platform. If you're not sure which to choose, learn more about installing packages.


