Visualization tool for FElupe

Project description
FEplot
A visualization tool for FElupe.
FEplot is based on the popular visualization library matplotlib which is a comprehensive library for creating static, animated, and interactive visualizations in Python. The main aim of this package is to visualize FElupe results (FElupe is a super finite element analysis package).
Setup
To run this project, you can easily install it locally using pip:
pip install feplot
All is ready now, let's move on!
How to Use
Starting with a quick example:
import felupe as fem
from feplot.pylab import Plotter
# create a hexahedron-region on a cube
mesh = fem.Cube(n=11)
region = fem.RegionHexahedron(mesh)
# add a field container (with a vector-valued displacement field)
field = fem.FieldContainer([fem.Field(region, dim=3)])
# apply a uniaxial elongation on the cube
boundaries = fem.dof.uniaxial(field, clamped=True)[0]
# define the constitutive material behaviour
# and create a nearly-incompressible (u,p,J - formulation) solid body
umat = fem.NeoHooke(mu=1)
solid = fem.SolidBodyNearlyIncompressible(umat, field, bulk=5000)
# prepare a step with substeps
move = fem.math.linsteps([0, 1], num=10)
step = fem.Step(
items=[solid],
ramp={boundaries["move"]: move},
boundaries=boundaries
)
# add the step to a job, evaluate all substeps
job = fem.Job(steps=[step])
job.evaluate()
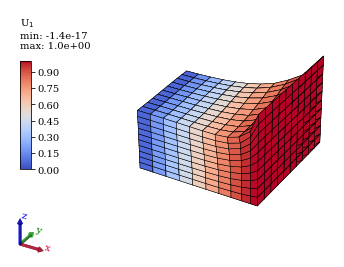
# initialize plotter
pl = Plotter()
# plot displacements results (X-Axis)
pl.plot_displacement(field, label='U$_1$', component=0)
# hide grid
pl.hide_grid()
# add orientation axes
pl.add_axes()
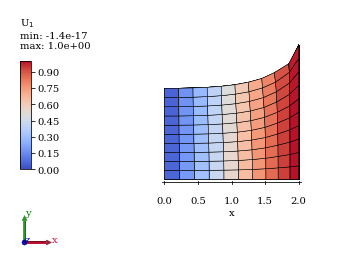
Here are some other features:
# set view to XY-Plane
pl.xy_view()
# add ruler (only for X-Axis)
pl.show_ruler(1, 0, 0)
License
FEplot - A visualization tool for FElupe (C) 2022 Mohamed ZAARAOUI, Tunisia.
This program is free software: you can redistribute it and/or modify it under the terms of the GNU General Public License as published by the Free Software Foundation, either version 3 of the License, or (at your option) any later version.
This program is distributed in the hope that it will be useful, but WITHOUT ANY WARRANTY; without even the implied warranty of MERCHANTABILITY or FITNESS FOR A PARTICULAR PURPOSE. See the GNU General Public License for more details.
You should have received a copy of the GNU General Public License along with this program. If not, see https://www.gnu.org/licenses/.


Download files
Download the file for your platform. If you're not sure which to choose, learn more about installing packages.


