Grep through all Grafana entities in the spirit of git-wtf

Project description


grafana-wtf
About
grafana-wtf - grep through all Grafana entities in the spirit of git-wtf.
Synopsis
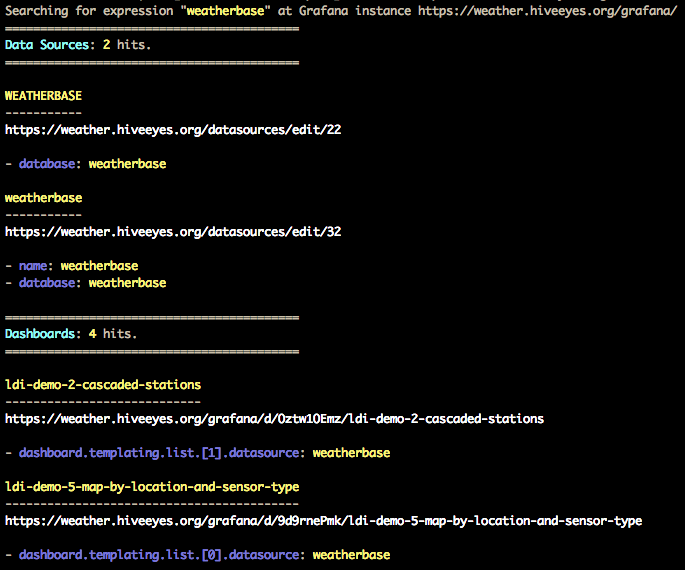
Search Grafana API for string “weatherbase”.
grafana-wtf find weatherbase
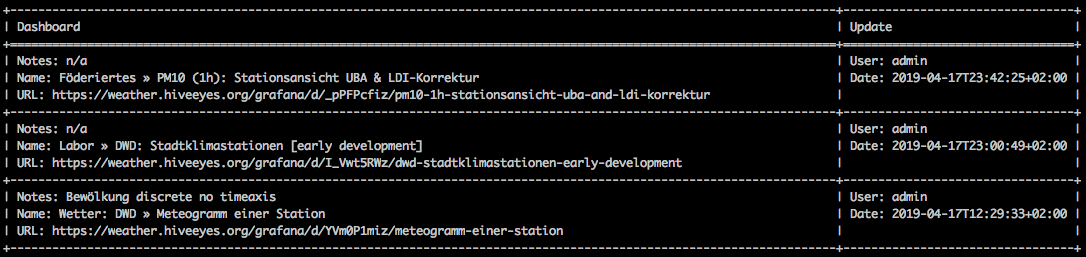
Display 50 most recent changes across all dashboards.
grafana-wtf log --number=50
Screenshots
grafana-wtf find
grafana-wtf log
Setup
Install grafana-wtf
pip install grafana-wtf
Configure Grafana
Please take these steps to create an API key with your Grafana instance:
Go to https://daq.example.org/grafana/org/apikeys.
Choose “New API Key”.
Key name: grafana-wtf
Role: Admin
From the output curl -H "Authorization: Bearer eyJrIjoiWHg...dGJpZCI6MX0=" ..., please take note of the Bearer token. This is your Grafana API key.
Usage
Before running grafana-wtf, define URL and access token of your Grafana instance:
export GRAFANA_URL=https://daq.example.org/grafana/
export GRAFANA_TOKEN=eyJrIjoiWHg...dGJpZCI6MX0=
Searching for strings
Find the string weatherbase throughout all dashboards and data sources:
grafana-wtf find weatherbase
Replacing strings
Replace all occurrences of ldi_v2 with ldi_v3 within dashboard with UID _JJ22OZZk:
grafana-wtf --select-dashboard=_JJ22OZZk replace ldi_v2 ldi_v3
Displaying changes / revision logs
Watching out for recent editing activity on any dashboards?:
# Display 50 most recent changes across all dashboards.
grafana-wtf log --number=50
Examples
For discovering more command line parameters and their arguments, please invoke grafana-wtf --help and have a look at grafana-wtf examples.
Development
git clone https://github.com/panodata/grafana-wtf
cd grafana-wtf
make test
Release history Release notifications | RSS feed


Download files
Download the file for your platform. If you're not sure which to choose, learn more about installing packages.


