Grep through all Grafana entities in the spirit of git-wtf

Project description


grafana-wtf
About
grafana-wtf - grep through all Grafana entities in the spirit of git-wtf.
Synopsis
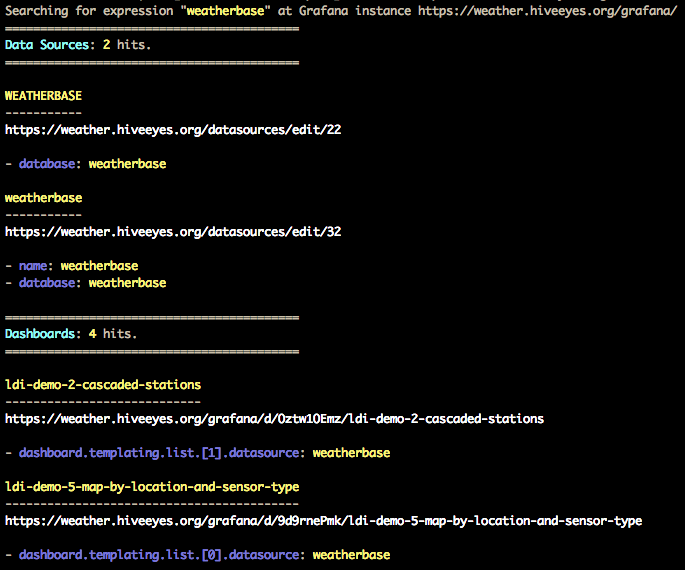
Search Grafana API for string “weatherbase”.
grafana-wtf find weatherbase
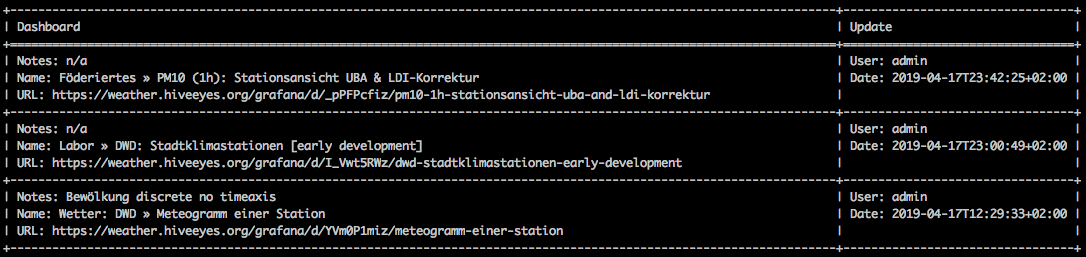
Display 50 most recent changes across all dashboards.
grafana-wtf log --number=50
Run with Docker:
# Access Grafana instance on localhost, without authentication.
docker run --rm -it --env GRAFANA_URL="http://host.docker.internal:3000" ghcr.io/panodata/grafana-wtf grafana-wtf info

# Access Grafana instance with authentication.
docker run --rm -it --env GRAFANA_URL="https://daq.grafana.org/grafana" --env GRAFANA_TOKEN="eyJrIjoiWHg...dGJpZCI6MX0=" ghcr.io/panodata/grafana-wtf grafana-wtf info
Screenshots
grafana-wtf find
grafana-wtf log
Setup
Install grafana-wtf
pip install grafana-wtf
Configure Grafana
Please take these steps to create an API key with your Grafana instance:
Go to https://daq.example.org/grafana/org/apikeys.
Choose “New API Key”.
Key name: grafana-wtf
Role: Admin
From the output curl -H "Authorization: Bearer eyJrIjoiWHg...dGJpZCI6MX0=" ..., please take note of the Bearer token. This is your Grafana API key.
Usage
Before running grafana-wtf, define URL and access token of your Grafana instance:
export GRAFANA_URL=https://daq.example.org/grafana/
export GRAFANA_TOKEN=eyJrIjoiWHg...dGJpZCI6MX0=
In order to ignore untrusted SSL certificates, append the ?verify=no query string to the GRAFANA_URL:
export GRAFANA_URL=https://daq.example.org/grafana/?verify=no
General information
# Display a bunch of meta information and statistics.
grafana-wtf info --format=yaml

# Display Grafana version.
grafana-wtf info --format=json | jq -r '.grafana.version'
Explore data sources
How to find unused data sources?
# Display all data sources and the dashboards using them, as well as unused data sources.
grafana-wtf explore datasources --format=yaml

# Display names of unused datasources as a flat list.
grafana-wtf explore datasources --format=json | jq -r '.unused[].datasource.name'
Explore dashboards
How to find dashboards which use non-existing data sources?
# Display some details of all dashboards, including names of missing data sources.
grafana-wtf explore dashboards --format=yaml

# Display only dashboards which have missing data sources, along with their names.
grafana-wtf explore dashboards --format=json | jq '.[] | select( .datasources_missing ) | .dashboard + {ds_missing: .datasources_missing[] | [.name]}'
Searching for strings
Find the string weatherbase throughout all dashboards and data sources:
grafana-wtf find weatherbase
Replacing strings
Replace all occurrences of ldi_v2 with ldi_v3 within dashboard with UID _JJ22OZZk:
grafana-wtf --select-dashboard=_JJ22OZZk replace ldi_v2 ldi_v3
In order to preview the changes, you should use the --dry-run option beforehand:
grafana-wtf --select-dashboard=_JJ22OZZk replace ldi_v2 ldi_v3 --dry-run
Display edit history
Watching out for recent editing activity on any dashboards?
# Display 50 most recent changes across all dashboards.
grafana-wtf log --number=50
Examples
For discovering more command line parameters and their arguments, please invoke grafana-wtf --help and have a look at grafana-wtf examples.
Development
git clone https://github.com/panodata/grafana-wtf
cd grafana-wtf

# Run all tests.
make test

# Run selected tests.
pytest --keepalive -vvv -k test_find_textual
Release history Release notifications | RSS feed


Download files
Download the file for your platform. If you're not sure which to choose, learn more about installing packages.
Source Distribution
Built Distribution
Hashes for grafana_wtf-0.14.0-py3-none-any.whl
| Algorithm | Hash digest | |
|---|---|---|
| SHA256 | 64016479fbd305df184d10d6bdde023ee81b9b24f6ec9e45b9c45d7527115dda |
|
| MD5 | 311876786b89ca52eea79a340040d3a0 |
|
| BLAKE2b-256 | 6f82dbeb7241e36163359e4ac99d75c72ab045f4012aa367a6c0926478157728 |


