Graphsignal Tracer
Project description
Graphsignal: Observability for AI Stack
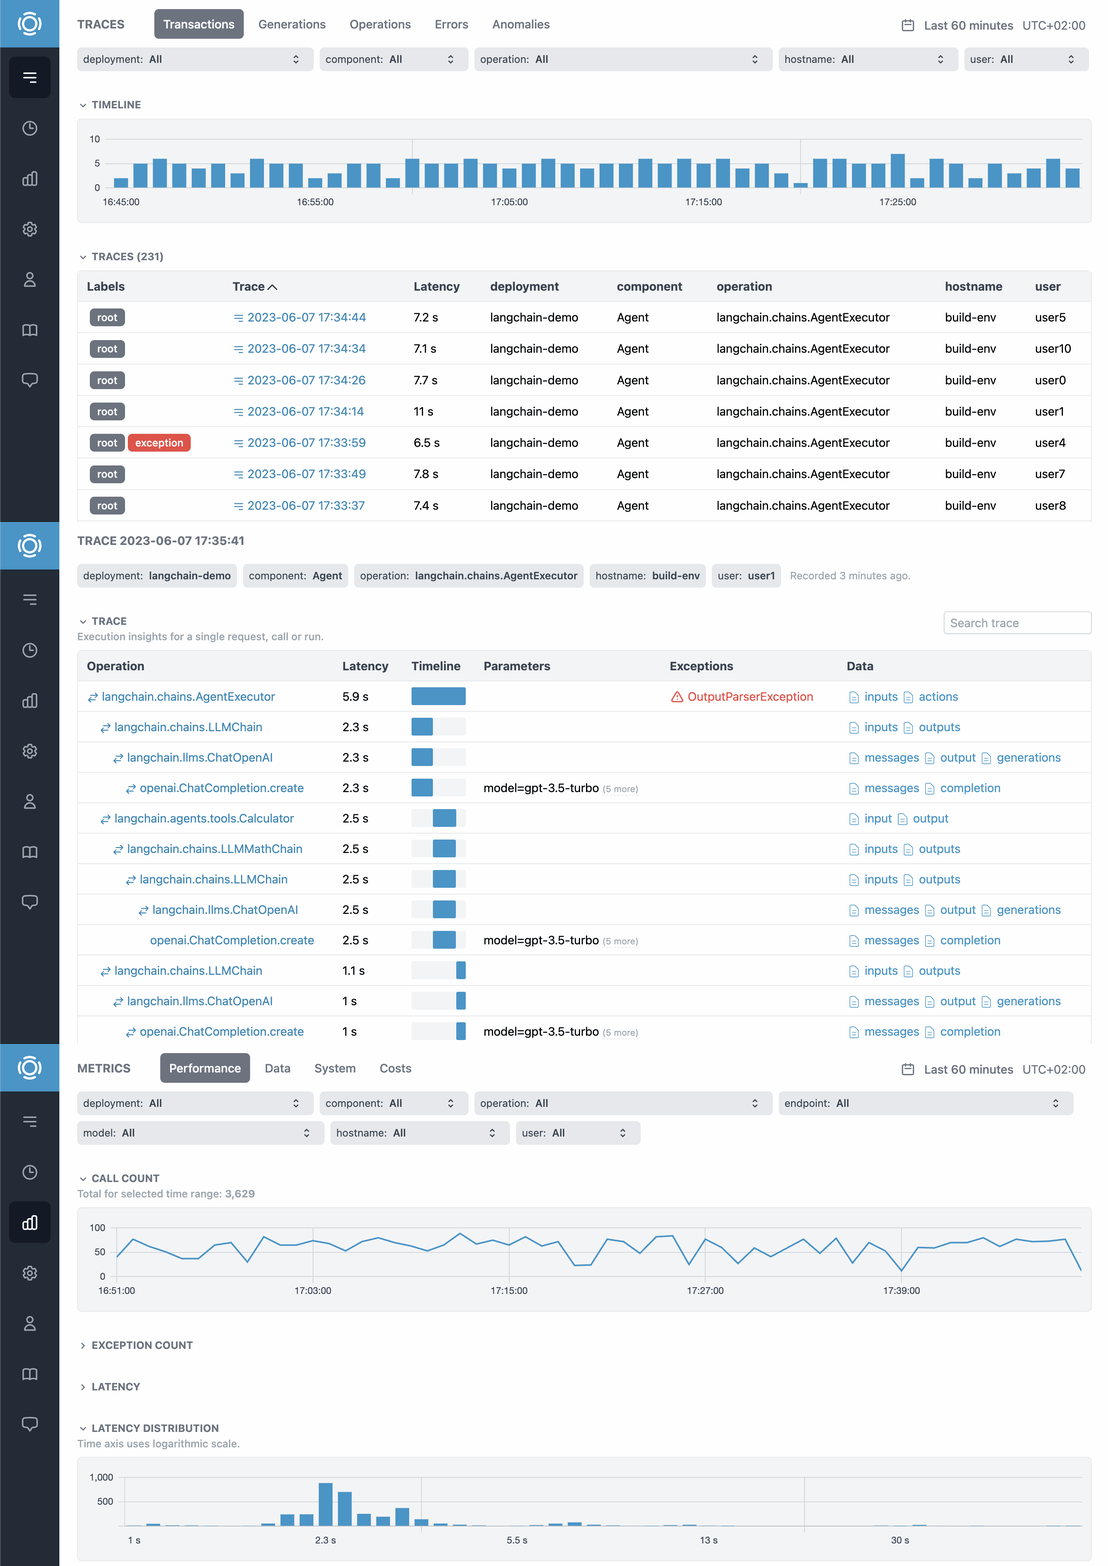
Graphsignal is an observability platform for AI agents and LLM-powered applications. It helps developers ensure AI applications run as expected and users have the best experience. With Graphsignal, developers can:
- Trace requests, runs, and sessions with full AI context.
- See latency breakdown by operations.
- Analyze model API costs for deployments, models, or users.
- Get notified about errors and anomalies.
- Monitor API, compute, and GPU utilization.
Learn more at graphsignal.com.
Install
Install Graphsignal library by running:
pip install graphsignal
Or clone and install the GitHub repository:
git clone https://github.com/graphsignal/graphsignal-python.git
python setup.py install
Configure
Configure Graphsignal tracer by specifying your API key directly or via GRAPHSIGNAL_API_KEY environment variable.
import graphsignal

graphsignal.configure(api_key='my-api-key', deployment='my-model-prod-v1')
To get an API key, sign up for a free account at graphsignal.com. The key can then be found in your account's Settings / API Keys page.
Alternatively, you can add Graphsignal tracer at command line, when running your module or script. Environment variables GRAPHSIGNAL_API_KEY and GRAPHSIGNAL_DEPLOYMENT must be set.
python -m graphsignal <script>
python -m graphsignal -m <module>
Integrate
Automatic integration
Graphsignal auto-instruments and traces libraries and frameworks, such as OpenAI, LangChain, LlamaIndex, Hugging Face. Traces, errors, and data, such as prompts and completions, are automatically recorded and available for analysis at app.graphsignal.com.
Some integration examples are available in examples repo.
User tracking
User tracking allows grouping and visualization of user-related traces, interactions, metrics, and costs. It also enables detection of user interaction outliers and other events.
To enable user tracking, set user identifier as user_id tag for every request, e.g. in a request handler:
graphsignal.set_context_tag('user_id', user_id)
or directly, when tracing manually:
with graphsignal.start_trace(tags=dict(user_id=user_id)):
    ...
If you are running a single process per user and added Graphsignal at command line, you can set the user_id tag in an environment variable.
env GRAPHSIGNAL_TAGS="user_id=123" python -m graphsignal <script>
Tracing any operation
To measure and monitor operations that are not automatically instrumented, e.g. any model inference or inference API calls, wrap the code with start_trace() method or use @trace_function decorator.
with graphsignal.start_trace('predict'):
    pred = model(x)
@graphsignal.trace_function
def predict(x):
    return model(x)
Enable profiling to additionally record code-level statistics. Profiling is disabled by default due to potential overhead. To enable, provide TraceOptions object.
with graphsignal.start_trace('predict', options=graphsignal.TraceOptions(enable_profiling=True)):
    pred = model(x)
The tracer will automatically choose a profiler depending on available modules. Currently, CProfile, PyTorch Kineto and Yappi are supported. The Kineto profiler is used if torch module is detected and Yappi profiler is used if yappi module is detected. Otherwise, CProfile is used. To properly profile asyncio coroutines, simply pip install yappi.
See API reference for full documentation.
Exception tracking
For auto-instrumented libraries, or when using @trace_function decorator, start_trace() method with with context manager or callbacks, exceptions are automatically recorded. For other cases, use Trace.add_exception.
Data monitoring
Data, such as prompts and completions, is automatically monitored for auto-instrumented libraries. To track data metrics and record data profiles for other cases, Trace.set_data() method can be used.
with graphsignal.start_trace('predict') as span:
    span.set_data('input', input_data)
The following data types are currently supported: list, dict, set, tuple, str, bytes, numpy.ndarray, tensorflow.Tensor, torch.Tensor.
Raw data samples, such as prompts and completions, are recorded by default. To disable, set record_data_samples=False in graphsignal.configure. Note, that data statistics, such as size, shape or number of missing values will still be recorded.
Observe
Log in to Graphsignal to monitor and analyze your application and monitor for issues.
Overhead
Graphsignal tracer is very lightweight. The overhead per trace is measured to be less than 100 microseconds.
Security and Privacy
Graphsignal tracer can only open outbound connections to signal-api.graphsignal.com and send data, no inbound connections or commands are possible.
Raw data samples, e.g. prompts, are recorded by default. This feature can be disabled at tracer initialization time, if necessary.
Troubleshooting
To enable debug logging, add debug_mode=True to configure(). If the debug log doesn't give you any hints on how to fix a problem, please report it to our support team via your account.
In case of connection issues, please make sure outgoing connections to https://signal-api.graphsignal.com are allowed.
Project details
Release history Release notifications | RSS feed
Download files
Download the file for your platform. If you're not sure which to choose, learn more about installing packages.


