A simple and efficient implementation of the Mapper Algorithm from Topological Data Analysis (TDA)

Project description
tda-mapper


In recent years, an ever growing interest in Topological Data Analysis (TDA) emerged in the field of data science. The core idea of TDA is to gain insights from data by using topological methods that are proved to be reliable with respect to noise, and that behave nicely with respect to dimension. This Python package provides an implementation of the Mapper Algorithm, a well-known tool from TDA.
The Mapper Algorithm takes any dataset $X$ and returns a shape-summary in the form a graph $G$, called Mapper Graph. It's possible to prove, under reasonable conditions, that $X$ and $G$ share the same number of connected components.
For an in-depth description of Mapper please read the original paper.
- Installation from package: TBD
- Installation from sources: clone this repo and run
python -m pip install . - Documentation: https://tda-mapper.readthedocs.io/en/latest/
Usage


import numpy as np
from sklearn.datasets import load_digits
from sklearn.cluster import AgglomerativeClustering
from sklearn.decomposition import PCA
from tdamapper.core import MapperAlgorithm
from tdamapper.cover import CubicalCover
from tdamapper.clustering import PermissiveClustering
from tdamapper.plot import MapperPlot
# We load a labelled dataset
X, y = load_digits(return_X_y=True)
# We compute the lens values
lens = PCA(2).fit_transform(X)
mapper_algo = MapperAlgorithm(
cover=CubicalCover(
n_intervals=10,
overlap_frac=0.65),
# We prevent clustering failures
clustering=PermissiveClustering(
clustering=AgglomerativeClustering(10),
verbose=False),
n_jobs=1)
mapper_graph = mapper_algo.fit_transform(X, lens)
mapper_plot = MapperPlot(X, mapper_graph,
# We color according to digit values
colors=y,
# Jet colormap, used for classes
cmap='jet',
# We aggregate on graph nodes according to mean
agg=np.nanmean,
dim=2,
iterations=400)
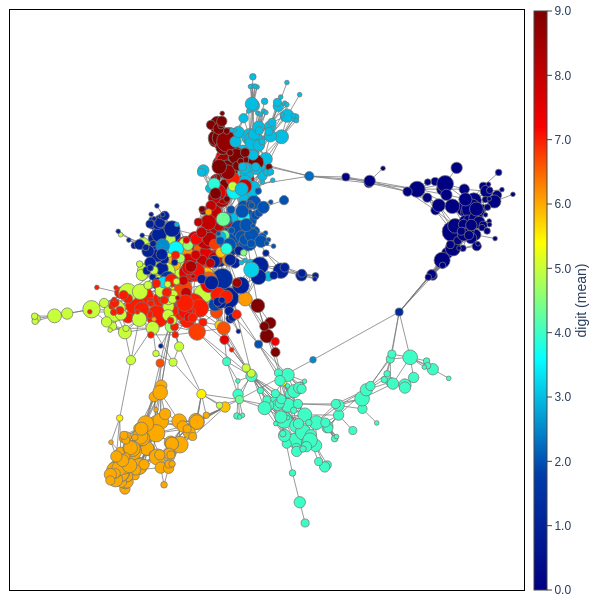
fig_mean = mapper_plot.plot(title='digit (mean)', width=600, height=600)
fig_mean.show(config={'scrollZoom': True})
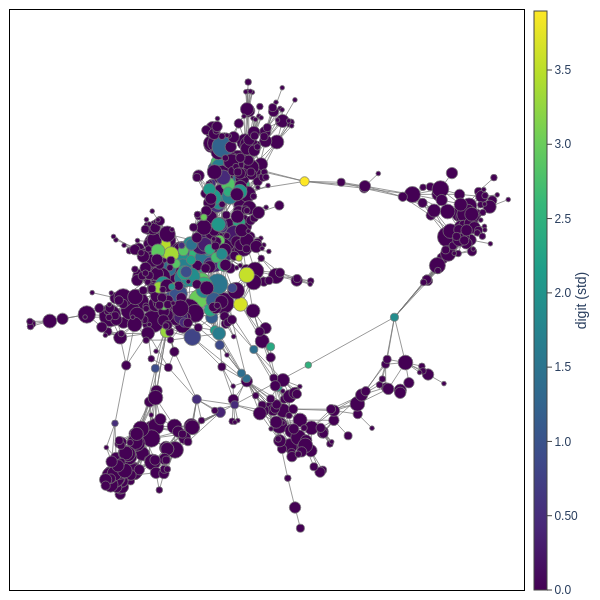
It's also possible to obtain a new plot colored according to different values, while keeping the same computed geometry. For example, if we want to visualize how much dispersion we have on each cluster, we could plot colors according to the standard deviation
# We reuse the graph plot with the same positions
fig_std = mapper_plot.with_colors(
    colors=y,
    # Viridis colormap, used for ranges
    cmap='viridis',
    # We aggregate on graph nodes according to std
    agg=np.nanstd,
).plot(title='digit (std)', width=600, height=600)
fig_std.show(config={'scrollZoom': True})
The mapper graph of the digits dataset shows a few interesting patterns. For example, we can make the following observations:
-
Clusters that share the same color are all connected together, and located in the same area of the graph. This behavior is present in those digits which are easy to tell apart from the others, for example digits 0 and 4.
-
Some clusters are not well separated and tend to overlap one on the other. This mixed behavior is present in those digits which can be easily confused one with the other, for example digits 5 and 6.
-
Clusters located across the "boundary" of two different digits show a transition either due to a change in distribution or due to distorsions in the hand written text, for example digits 8 and 2.


Download files
Download the file for your platform. If you're not sure which to choose, learn more about installing packages.
Source Distribution
Built Distribution
Hashes for tda_mapper-0.1.0-py3-none-any.whl
| Algorithm | Hash digest | |
|---|---|---|
| SHA256 | d46a6200ae571c89303f3b66595a9d4192467d579f396d5b608ae92e7dcdc97c |
|
| MD5 | dc04588b3ba96b2aabb91fb299f8ea95 |
|
| BLAKE2b-256 | cdfaa8756a6279ca98013003fb704507832fd514697e82d0a82d417e8e72bb62 |


