A simple and efficient Python implementation of Mapper algorithm for Topological Data Analysis

Project description


tda-mapper
A simple and efficient Python implementation of Mapper algorithm for Topological Data Analysis
-
Installation:
pip install tda-mapper -
Documentation: https://tda-mapper.readthedocs.io/en/main/
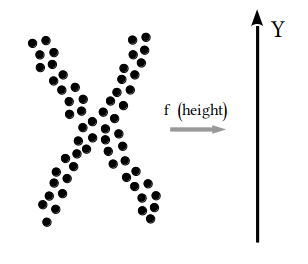
The Mapper algorithm is a well-known technique in the field of topological data analysis that allows data to be represented as a graph. Mapper is used in various fields such as machine learning, data mining, and social sciences, due to its ability to preserve topological features of the underlying space, providing a visual representation that facilitates exploration and interpretation. For an in-depth coverage of Mapper you can read the original paper.
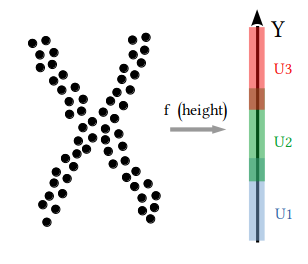
| Step 1 | Step 2 | Step 3 | Step 4 |
|---|---|---|---|
 |
 |
 |
 |
| Chose lens | Cover image | Run clustering | Build graph |
Example
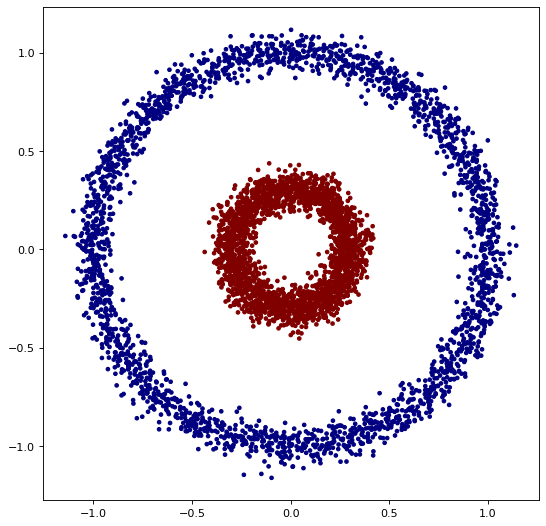
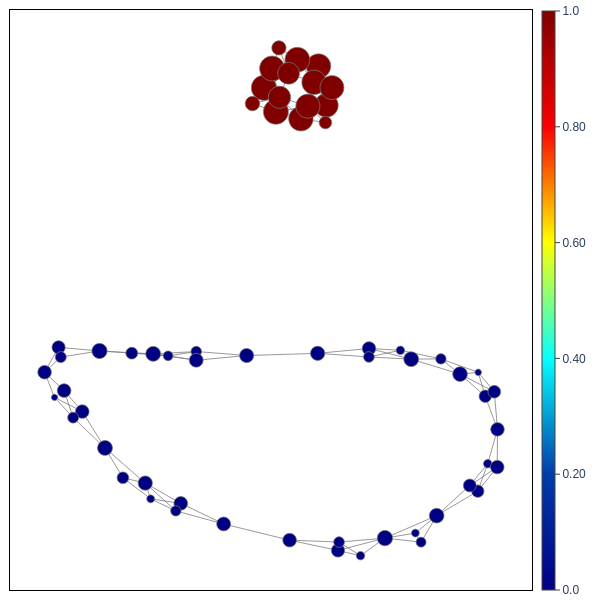
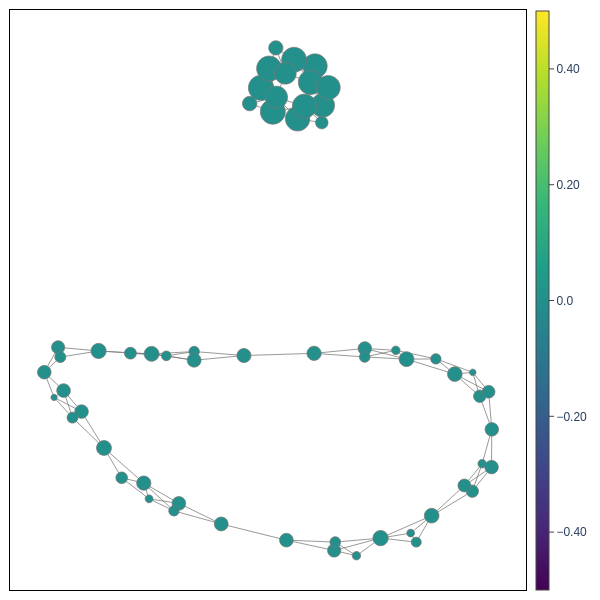
Here you can find an example to use to kickstart your analysis. In this toy-example we use a two-dimensional dataset of two concentric circles. The Mapper graph is a topological summary of the whole point cloud.
import numpy as np

from sklearn.datasets import make_circles
from sklearn.decomposition import PCA
from sklearn.cluster import DBSCAN

from tdamapper.core import MapperAlgorithm
from tdamapper.cover import CubicalCover
from tdamapper.plot import MapperLayoutInteractive

X, y = make_circles(                # load a labelled dataset
    n_samples=5000,
    noise=0.05,
    factor=0.3,
    random_state=42)
lens = PCA(2).fit_transform(X)

mapper_algo = MapperAlgorithm(
    cover=CubicalCover(
        n_intervals=10,
        overlap_frac=0.3),
    clustering=DBSCAN())
mapper_graph = mapper_algo.fit_transform(X, lens)

mapper_plot = MapperLayoutInteractive(
    mapper_graph,
    colors=y,                       # color according to categorical values
    cmap='jet',                     # Jet colormap, for classes
    agg=np.nanmean,                 # aggregate on nodes according to mean
    dim=2,
    iterations=60,
    seed=42,
    width=600,
    height=600)

fig_mean = mapper_plot.plot()
fig_mean.show(config={'scrollZoom': True})

mapper_plot.update(                 # reuse the plot with the same positions
    colors=y,
    cmap='viridis',                 # viridis colormap, for ranges
    agg=np.nanstd,                  # aggregate on nodes according to std
)

fig_std = mapper_plot.plot()
fig_std.show(config={'scrollZoom': True})
| Dataset | Mapper graph (average) | Mapper graph (deviation) |
|---|---|---|
 |
 |
 |
More examples can be found in the documentation https://tda-mapper.readthedocs.io/en/main/.
Citations
To cite tda-mapper in your work you can use the Zenodo archive https://doi.org/10.5281/zenodo.10642381.
In the archive you can find a permanent reference to the exact version you used in your work.
For example, to cite version v0.4.0 you can use:
Simi, L. (2024). tda-mapper (v0.4.0). Zenodo. https://doi.org/10.5281/zenodo.10655755
BibTeX entry:
@software{tda-mapper_v0.4.0,
  author       = {Simi, Luca},
  title        = {tda-mapper},
  month        = feb,
  year         = 2024,
  publisher    = {Zenodo},
  version      = {v0.4.0},
  doi          = {10.5281/zenodo.10655755},
  url          = {https://doi.org/10.5281/zenodo.10655755}
}


Download files
Download the file for your platform. If you're not sure which to choose, learn more about installing packages.
Source Distribution
Built Distribution
Hashes for tda_mapper-0.5.1-py3-none-any.whl
| Algorithm | Hash digest | |
|---|---|---|
| SHA256 | 2c7d28cb656f53adbd381b935d0c8fdfe54ce67527b4ab1f7ab223178f673d6b |
|
| MD5 | b47801323061454166a0d908f26bed3d |
|
| BLAKE2b-256 | d7fd82cf5f2d11d23405e63f5d66e5517b64348e3ae3f4feafc5ec3bb662e71c |


