xicorrelation

Project description


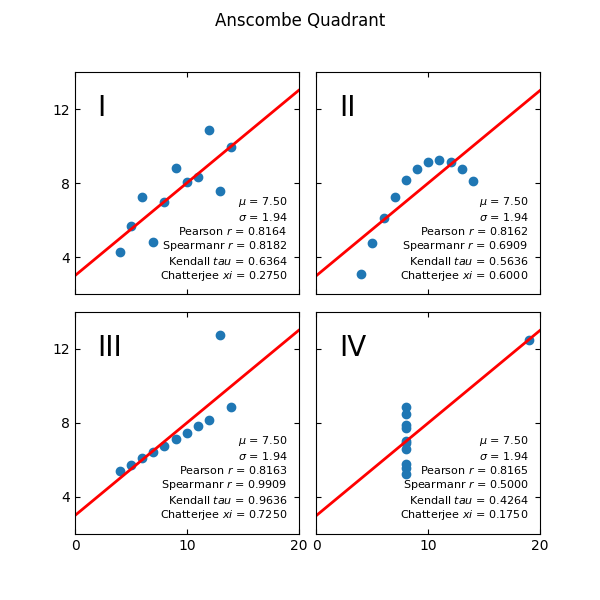
xicorrelation package implements xi correlation formula proposed in https://arxiv.org/pdf/1909.10140.pdf.
It is based off the R code mentioned in the paper: https://statweb.stanford.edu/~souravc/xi.R and R package https://github.com/cran/XICOR
|
Simple example
from xicorrelation import xicorr

x = [10, 8, 13, 9, 11, 14, 6, 4, 12, 7, 5]
y = [8.04, 6.95, 7.58, 8.81, 8.33, 9.96, 7.24, 4.26, 10.84, 4.82, 5.68]

# API similar to spearmanr or kendalltau from scipy
xi, pvalue = xicorr(x, y)
print("xi", xi)
print("pvalue", pvalue)
Installation
Installation process is simple, just:
$ pip install xicorrelation
Changes
0.3.0
Rework API do be similar to scipy.
0.2.1
Initial release.
Release history Release notifications | RSS feed


Download files
Download the file for your platform. If you're not sure which to choose, learn more about installing packages.
Source Distribution
xicorrelation-0.3.0.tar.gz
(58.8 kB
view hashes)
Built Distribution
Close
Hashes for xicorrelation-0.3.0-py3-none-any.whl
| Algorithm | Hash digest | |
|---|---|---|
| SHA256 | d3178d16d1bfac5e8e997cc97dd199cab536bf916ec04c2c8555623ab1cdcacf |
|
| MD5 | 06df824c86447fc3b01bc9550678aad9 |
|
| BLAKE2b-256 | d4e3c3e8b87e550f8846ac27565276b96d39e908b3e362790e8dd86bfe3b17bb |


