xicorrelation 0.3.0
pip install xicorrelation
Latest version
Released:
xicorrelation
Navigation

Unverified details
These details have not been verified by PyPIProject links
Meta
- License: Apache Software License (Apache 2)
- Author: Nikolay Novik
- Tags correlation, statistics
- Requires: Python >=3.6.0
Classifiers
- Development Status
- Intended Audience
- License
- Operating System
- Programming Language
- Topic
Project description


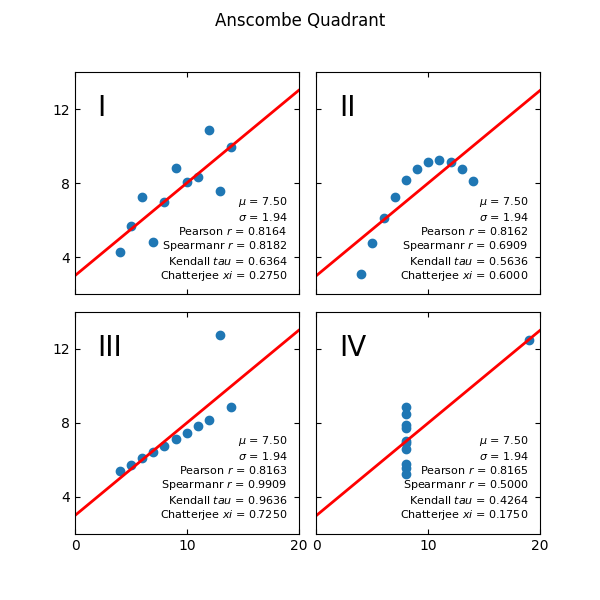
xicorrelation package implements xi correlation formula proposed in https://arxiv.org/pdf/1909.10140.pdf.
It is based off the R code mentioned in the paper: https://statweb.stanford.edu/~souravc/xi.R and R package https://github.com/cran/XICOR
|
Simple example
from xicorrelation import xicorr

x = [10, 8, 13, 9, 11, 14, 6, 4, 12, 7, 5]
y = [8.04, 6.95, 7.58, 8.81, 8.33, 9.96, 7.24, 4.26, 10.84, 4.82, 5.68]

# API similar to spearmanr or kendalltau from scipy
xi, pvalue = xicorr(x, y)
print("xi", xi)
print("pvalue", pvalue)
Installation
Installation process is simple, just:
$ pip install xicorrelation
Changes
0.3.0
Rework API do be similar to scipy.
0.2.1
Initial release.
Project details
Unverified details
These details have not been verified by PyPIProject links
Meta
- License: Apache Software License (Apache 2)
- Author: Nikolay Novik
- Tags correlation, statistics
- Requires: Python >=3.6.0
Classifiers
- Development Status
- Intended Audience
- License
- Operating System
- Programming Language
- Topic
Release history Release notifications | RSS feed


Download files
Download the file for your platform. If you're not sure which to choose, learn more about installing packages.
Source Distribution
Built Distribution
File details
Details for the file xicorrelation-0.3.0.tar.gz.
File metadata
- Download URL: xicorrelation-0.3.0.tar.gz
- Upload date:
- Size: 58.8 kB
- Tags: Source
- Uploaded using Trusted Publishing? No
- Uploaded via: twine/3.7.1 importlib_metadata/4.10.0 pkginfo/1.8.2 requests/2.26.0 requests-toolbelt/0.9.1 tqdm/4.62.3 CPython/3.9.9
File hashes
| Algorithm | Hash digest | |
|---|---|---|
| SHA256 | 756e2f11424fd3ff4171a8bb9a4686932f83bfbf3ad932ad74f44e145427e703 |
|
| MD5 | cb31d0e1784f106c49f4c20c0e203e0c |
|
| BLAKE2b-256 | 7f5c1bee76a90c67f685763892db2e969379ef3efb63aa43eb415882a3a96742 |
File details
Details for the file xicorrelation-0.3.0-py3-none-any.whl.
File metadata
- Download URL: xicorrelation-0.3.0-py3-none-any.whl
- Upload date:
- Size: 8.6 kB
- Tags: Python 3
- Uploaded using Trusted Publishing? No
- Uploaded via: twine/3.7.1 importlib_metadata/4.10.0 pkginfo/1.8.2 requests/2.26.0 requests-toolbelt/0.9.1 tqdm/4.62.3 CPython/3.9.9
File hashes
| Algorithm | Hash digest | |
|---|---|---|
| SHA256 | d3178d16d1bfac5e8e997cc97dd199cab536bf916ec04c2c8555623ab1cdcacf |
|
| MD5 | 06df824c86447fc3b01bc9550678aad9 |
|
| BLAKE2b-256 | d4e3c3e8b87e550f8846ac27565276b96d39e908b3e362790e8dd86bfe3b17bb |


