A collection of helper for pandas n plots

Project description
pandas-plots


usage
install / update package
pip install pandas-plots -U
include in python
from pandas_plots import tbl, viz
example
# load sample dataset from seaborn
import seaborn as sb
df = sb.load_dataset('taxis')
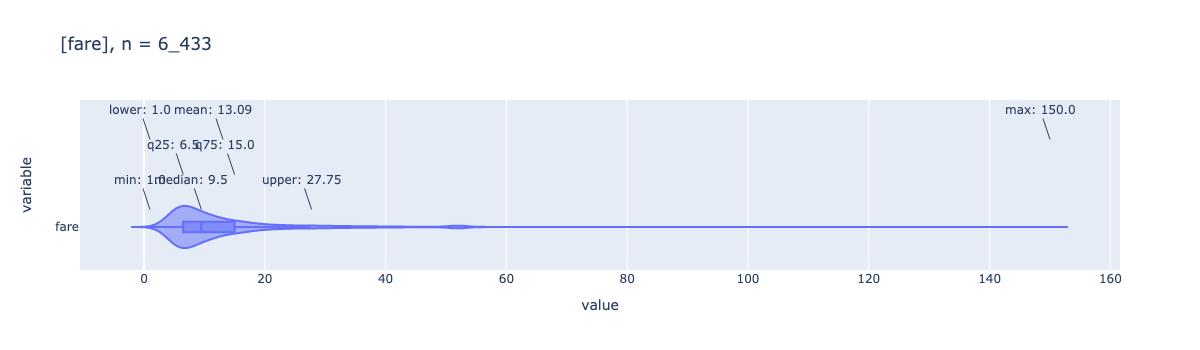
viz.plot_box(df['fare'], height=400, violin=True)
why use pandas-plots
pandas-plots is a package to help you examine and visualize data that are organized in a pandas DataFrame. It provides a high level api to pandas / plotly with some selected functions.
It is subdivided into:
-
tblutilities for table descriptionsdescribe_df()an alternative version of pandasdescribe()functionpivot_df()gets a pivot table of a 3 column dataframe
-
vizutilities for plotly visualizationsplot_box()auto annotated boxplot w/ violin optionplot_boxes()multiple boxplots (annotation is experimental)plots_bars()a standardized bar plotplot_stacked_bars()shortcut to stacked bars 😄plot_quadrants()quickly show a 2x2 heatmap
-
sqlis added as convienience wrapper for fetching data from sql databasesconnect_sqlget data from['mssql', 'sqlite','postgres']
dependencies
Release history Release notifications | RSS feed


Download files
Download the file for your platform. If you're not sure which to choose, learn more about installing packages.
Source Distribution
pandas-plots-0.3.2.tar.gz
(16.1 kB
view hashes)
Built Distribution
Close
Hashes for pandas_plots-0.3.2-py3-none-any.whl
| Algorithm | Hash digest | |
|---|---|---|
| SHA256 | a85a30b2051d009860752b2e21e13fe896f6e18b9585e09044d1138e2c13779e |
|
| MD5 | 81f65ff310bbee84d9c7591f0e59b69e |
|
| BLAKE2b-256 | 465ee2541f0032a35615146de88561a481f2e7abc558da329fe230727bf6f826 |


