A collection of helper for table handling and vizualization

Project description
pandas-plots


usage
install / update package
pip install pandas-plots -U
include in python
from pandas_plots import tbl, plt, ven
example
# load sample dataset from seaborn
import seaborn as sb
df = sb.load_dataset('taxis')
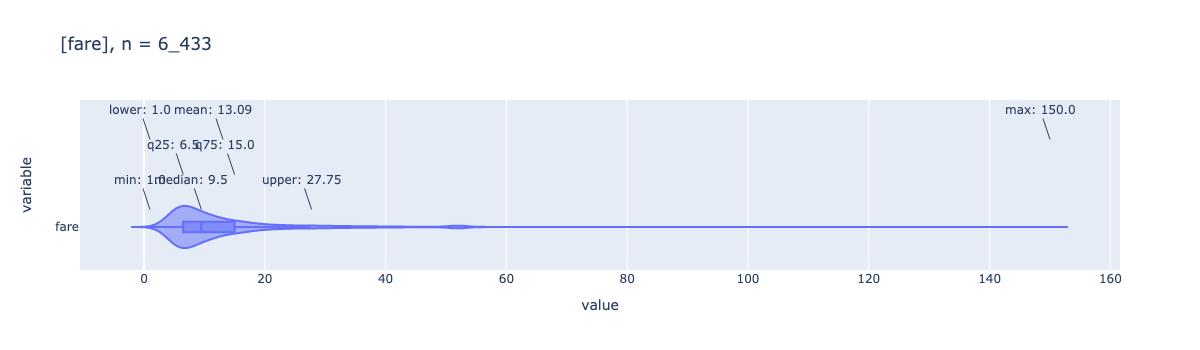
plt.plot_box(df['fare'], height=400, violin=True)
why use pandas-plots
pandas-plots is a package to help you examine and visualize data that are organized in a pandas DataFrame. It provides a high level api to pandas / plotly with some selected functions.
It is subdivided into:
-
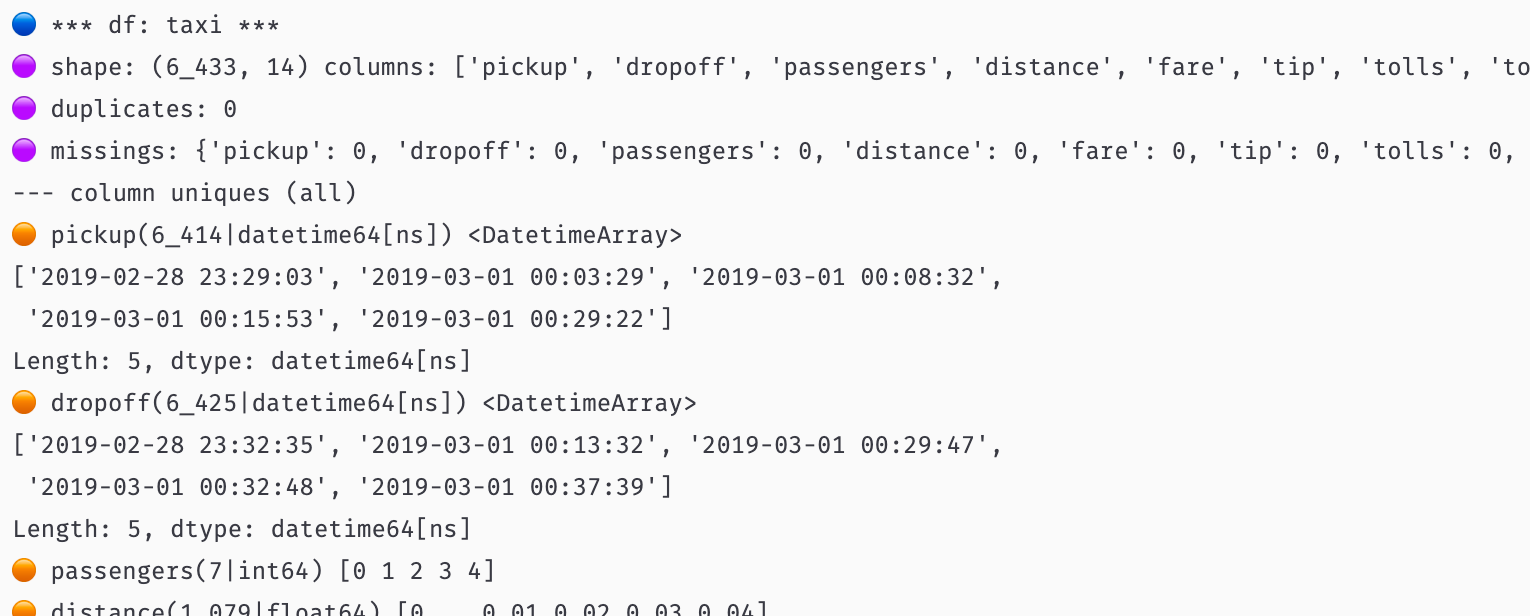
tblutilities for table descriptionsdescribe_df()an alternative version of pandasdescribe()functionpivot_df()gets a pivot table of a 3 column dataframe
-
pltfor plotly visualizationsplot_box()auto annotated boxplot w/ violin optionplot_boxes()multiple boxplots (annotation is experimental)plots_bars()a standardized bar plotplot_stacked_bars()shortcut to stacked bars 😄plot_quadrants()quickly shows a 2x2 heatmap
-
venoffers functions for venn diagramsshow_venn2()displays a venn diagram for 2 setsshow_venn3()displays a venn diagram for 3 sets
-
sqlis added as convienience wrapper for retrieving data from sql databasesconnect_sqlget data from['mssql', 'sqlite','postgres']
-
txtincludes some text based utilitieswrapformats strings or lists to a given width to fit nicely on the screen
more examples
# quick and exhaustive description of any table
tbl.describe_df(df, 'taxis', top_n_uniques=5)
# show pivoted values for selected columns
tbl.pivot_df(df[['color', 'payment', 'fare']])

# show venn diagram for 3 sets
from pandas_plots import ven

set_a = set(df.pickup_zone)
set_b = set(df.dropoff_zone)
set_c = set(df['pickup_borough'])
_df, _details = ven.show_venn3(
    "taxis",
    set_a,
    "pick",
    set_b,
    "drop",
    c_set=set_c,
    c_label="borough",
    verbose=0,
    size=8,
)

dependencies
Release history Release notifications | RSS feed


Download files
Download the file for your platform. If you're not sure which to choose, learn more about installing packages.
Source Distribution
pandas-plots-0.8.1.tar.gz
(19.8 kB
view hashes)
Built Distribution
Close
Hashes for pandas_plots-0.8.1-py3-none-any.whl
| Algorithm | Hash digest | |
|---|---|---|
| SHA256 | d12d209cd1facf634f08cf4c1028a1a861e12e0a4a3d3ebd3a528c7de7d7dc1a |
|
| MD5 | 161acc2961556d7c31165c74fb92921c |
|
| BLAKE2b-256 | a27ab3773eb75ad14c31ee4e562d58cda15c9d42bc91a4278ee229b6abd5b67b |


