A genome visualization python package for comparative genomics

Project description
pyGenomeViz


Overview
pyGenomeViz is a genome visualization python package for comparative genomics implemented in matplotlib. This package is developed for the purpose of easily and beautifully plotting genomic features and sequence similarity comparison links between multiple genomes. It supports genome visualization of Genbank format file, and can be used to interactively plot genome visualization figure on jupyter notebook, or for integration into a genome analysis pipeline.
For more information, please see full documentation here.
Installation
Python 3.7 or later is required for installation.
Install PyPI package:
pip install pygenomeviz
Install bioconda package:
conda install -c conda-forge -c bioconda pygenomeviz
Examples
Jupyter notebooks containing code examples below is available here.
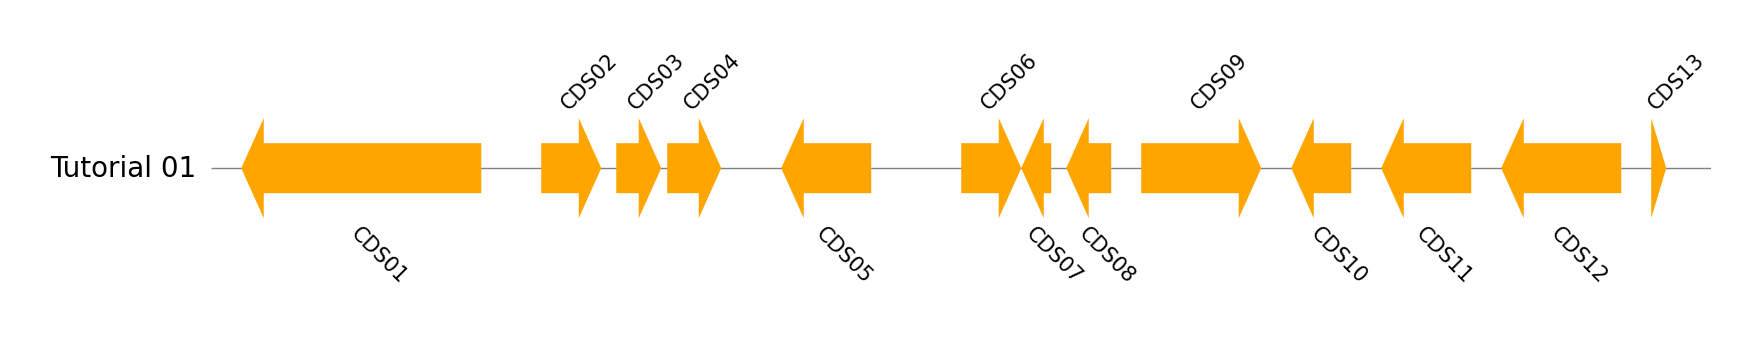
Basic Example
Single Genome Track Visualization
from pygenomeviz import GenomeViz

name, genome_size = "Tutorial 01", 5000
cds_list = ((100, 900, -1), (1100, 1300, 1), (1350, 1500, 1), (1520, 1700, 1), (1900, 2200, -1), (2500, 2700, 1), (2700, 2800, -1), (2850, 3000, -1), (3100, 3500, 1), (3600, 3800, -1), (3900, 4200, -1), (4300, 4700, -1), (4800, 4850, 1))

gv = GenomeViz()
track = gv.add_feature_track(name, genome_size)
for idx, cds in enumerate(cds_list, 1):
    start, end, strand = cds
    track.add_feature(start, end, strand, label=f"CDS{idx:02d}")

fig = gv.plotfig()
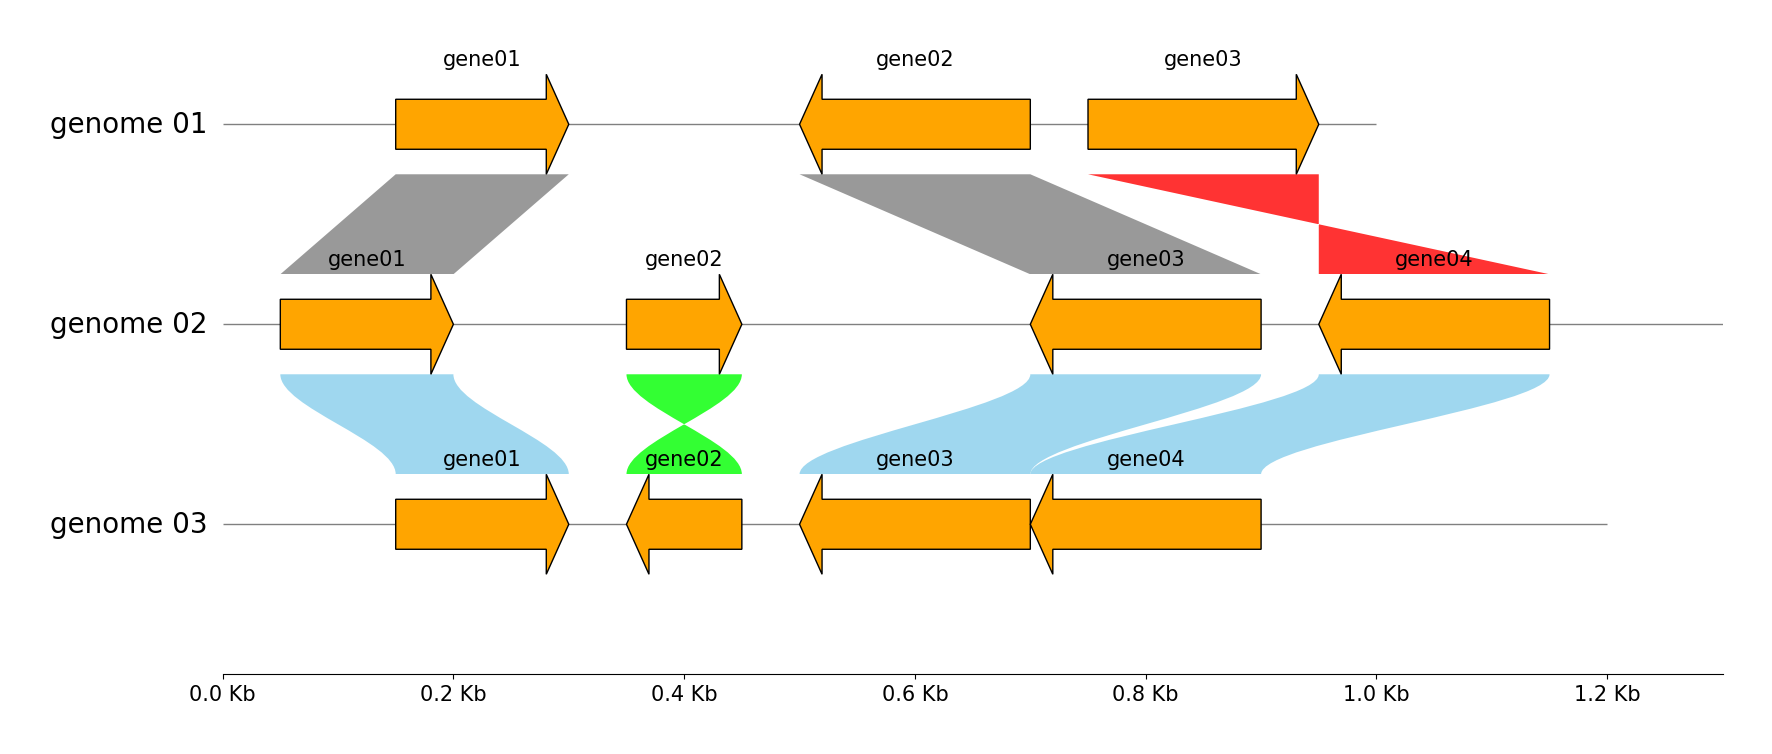
Multiple Genome Track & Link Visualization
from pygenomeviz import GenomeViz

genome_list = (
    {"name": "genome 01", "size": 1000, "cds_list": ((150, 300, 1), (500, 700, -1), (750, 950, 1))},
    {"name": "genome 02", "size": 1300, "cds_list": ((50, 200, 1), (350, 450, 1), (700, 900, -1), (950, 1150, -1))},
    {"name": "genome 03", "size": 1200, "cds_list": ((150, 300, 1), (350, 450, -1), (500, 700, -1), (701, 900, -1))},
)

gv = GenomeViz(tick_style="axis")
for genome in genome_list:
    name, size, cds_list = genome["name"], genome["size"], genome["cds_list"]
    track = gv.add_feature_track(name, size)
    for idx, cds in enumerate(cds_list, 1):
        start, end, strand = cds
        track.add_feature(start, end, strand, label=f"gene{idx:02d}", linewidth=1, labelrotation=0, labelvpos="top", labelhpos="center", labelha="center")

# Add links between "genome 01" and "genome 02"
gv.add_link(("genome 01", 150, 300), ("genome 02", 50, 200))
gv.add_link(("genome 01", 700, 500), ("genome 02", 900, 700))
gv.add_link(("genome 01", 750, 950), ("genome 02", 1150, 950))
# Add links between "genome 02" and "genome 03"
gv.add_link(("genome 02", 50, 200), ("genome 03", 150, 300), normal_color="skyblue", inverted_color="lime")
gv.add_link(("genome 02", 350, 450), ("genome 03", 450, 350), normal_color="skyblue", inverted_color="lime")
gv.add_link(("genome 02", 900, 700), ("genome 03", 700, 500), normal_color="skyblue", inverted_color="lime")
gv.add_link(("genome 03", 900, 701), ("genome 02", 1150, 950), normal_color="skyblue", inverted_color="lime")

fig = gv.plotfig()
Practical Example
Single Genome Track Visualization from Genbank file
from pygenomeviz import Genbank, GenomeViz, load_dataset

# Load single genbank file
gbk_files, _ = load_dataset("escherichia_phage")
gbk = Genbank(gbk_files[0])

# Visualize genbank features
gv = GenomeViz()
track = gv.add_feature_track(gbk.name, gbk.genome_length)
track.add_genbank_features(gbk)

fig = gv.plotfig()

Multiple Genome Track & Link Visualization from Genbank files
from pygenomeviz import Genbank, GenomeViz, load_dataset

gv = GenomeViz(
    feature_track_ratio=0.5,
    link_track_ratio=1.0,
    tick_track_ratio=0.5,
    tick_style="bar",
    align_type="center",
)

gbk_files, links = load_dataset("escherichia_phage")
for gbk_file in gbk_files:
    gbk = Genbank(gbk_file)
    track = gv.add_feature_track(gbk.name, gbk.genome_length)
    track.add_genbank_features(gbk)

for link in links:
    link_data1 = (link.ref_name, link.ref_start, link.ref_end)
    link_data2 = (link.query_name, link.query_start, link.query_end)
    gv.add_link(link_data1, link_data2, interpolation_value=link.identity, curve=True)

fig = gv.plotfig()

Customization Tips
Since pyGenomeViz is implemented based on matplotlib, users can easily customize the figure in the manner of matplotlib. Here are some tips for figure customization.
- Add
GC content&GC skewsubtrack - Add annotation (Fill Box, ROI)
- Add colorbar (Experimetal implementation)
Release history Release notifications | RSS feed


Download files
Download the file for your platform. If you're not sure which to choose, learn more about installing packages.
Source Distribution
Built Distribution
Hashes for pygenomeviz-0.0.8-py3-none-any.whl
| Algorithm | Hash digest | |
|---|---|---|
| SHA256 | 48c242d06d391af552207627f972f23c0a3d6ae388aaad78bae4669c6c93b795 |
|
| MD5 | af971eea0fa58c43f4a8a39d9569b979 |
|
| BLAKE2b-256 | 48e1c9dbd5deb696f2a5fee2148561e7b3487158ffc267b3f1ef824fabec46db |


