Saves plots as PDF with embedded generating script

Project description
Overview
The pypdfplot package provides a backend to Matplotlib that generates a PDF file of the plot with the generating Python script embedded.
Normally, once a Matplotlib plot is saved as PNG or PDF file, the link between the plot and its generating Python script is lost. The philosophy behind pypdfplot is that there should be no distinction between the Python script that generates a plot and its output PDF file, much like there is no such distinction in an Origin or Excel file. As far as pypdfplot is concerned, the generating script is the plot.
When the pypdfplot backend is loaded and a figure is saved with plt.savefig(), the generating Python script is embedded into the output PDF file in such a way that when the PDF file is renamed from .pdf to .py, the file can be read by a Python interpreter directly without alteration. The script can be modified to implement changes in the plot, after which the script is ran again to produce the updated PDF file of the plot – including the updated embedded generating script.
The resulting file is both a valid Python file and a valid PDF file, and is conveniently call a PyPDF file. The compatibility with both Python and PDF is achieved by arranging the data blocks in the PyPDF file in a very specific order, such that the PDF-part is read as comment block in Python, and the Python-part is seen as an embedded file by a PDF reader.
To learn more about how to use pypdfplot, continue with reading Quickstart, or check out the commented examples in the examples folder.
Installation
PyPI repository
Install the package from the PyPI repository opening a command prompt and enter:
pip install pypdfplotGithub or download
Alternatively, the source files can be downloaded directly from the GitHub repository. After downloading the source files, navigate to the project directory and install the package by opening a command prompt and enter:
python setup.py installQuickstart
In this example, a plot is produced with Matplotlib and saved as PyPDF-file using the pypdfplot backend.
First, create a new python file and call it e.g. example.py.
To produce a PyPDF-file, all you have to do is import the pypdfplot backend by adding the line import pypdfplot.backend before importing Matplotlib:
import pypdfplot.backend
import matplotlib.pyplot as plt
import numpy as np

x = np.arange(-10,20,0.1)
y = x**2

plt.plot(x,y)
plt.savefig('example.pdf')
After running this script, the file example.py will have been removed and replaced by a new file example.pdf:
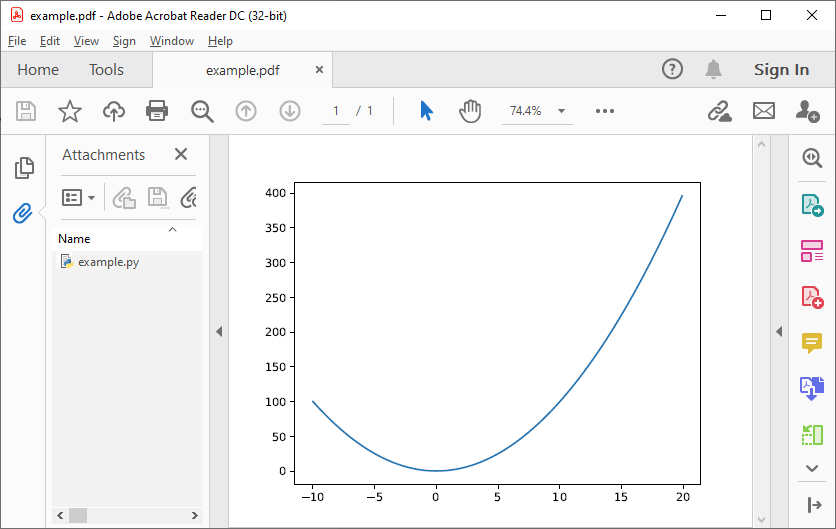
As can be seen in the “Attachments” column on the left, the orginal example.py generating script is embedded in the PDF file.
The script can be accessed by renaming example.pdf back to example.py and opening it in a text editor:
#%PDF-1.4 24 0 obj << /Type /EmbeddedFile /Length        690 >> stream
import pypdfplot.backend
import matplotlib.pyplot as plt
import numpy as np

x = np.arange(-10,20,0.1)
y = x**2

plt.plot(x,y)
plt.savefig('example.pdf')

"""
--- Do not edit below ---
endstream
endobj
1 0 obj

<< ... >>

startxref
9567
%%EOF
0000010174 LF
PyPDF-1.0
"""
It can be seen that after saving the plot with the pypdfplot backend, a commented line was added at the first line and a large comment block was appended at the end of the file. These comments contain all the necessary data for displaying the PDF and should not be altered directly by the user.
To update the plot, the user should instead modify the generating Python script and the PDF will be updated after running the script again!
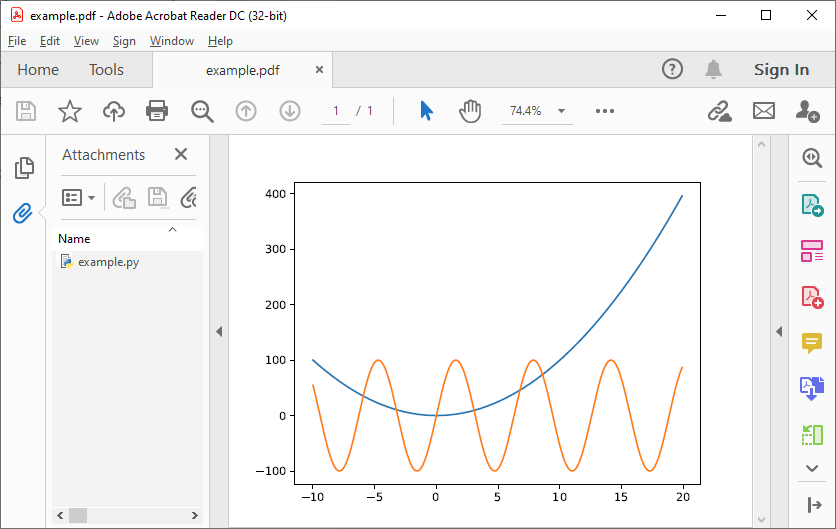
For example, let’s add another plot, e.g. a sine function:
#%PDF-1.4 24 0 obj << /Type /EmbeddedFile /Length        690 >> stream
import pypdfplot.backend
import matplotlib.pyplot as plt
import numpy as np

x = np.arange(-10,20,0.1)
y1 = x**2
y2 = 100*np.sin(x)

plt.plot(x,y1)
plt.plot(x,y2)
plt.savefig('example.pdf')

"""
--- Do not edit below ---
endstream
endobj
1 0 obj

<< ... >>

startxref
9567
%%EOF
0000010174 LF
PyPDF-1.0
"""
After running example.py, the file is again replaced by our updated example.pdf:
Functions
savefig()
Saves the current plot as PyPDF file.
savefig(fname,
        pack_list = [],
        cleanup = True,
        multiple = 'pickle',
        force_pickle = False,
        verbose = True
        prompt_overwrite = False,
**kwargs)- fname:
str
Filename of the output file.
- pack_list:
list, default = []
List with filenames that will be embedded in the PyPDF-file. The generating script is added separately and should not be included here. See Packing and unpacking for more details.
- multiple:
str, default = 'pickle'
How to handle multiple plots in a single generating script. Can be any of 'pickle', 'add_page', or 'finalize'. See Multiple plots for more details
- cleanup:
bool, default = True
Whether or not to cleanup files that have been embedded in the PyPDF file. Set to False and run script to extract embedded files.
- force_pickle:
bool, default = False
Pickles the figure and embeds a Python script that unpickles and reads the figure again. This can be useful when dealing with very large source files, see Pickling for more details.
- verbose:
bool, default = True
Wether or not to show verbose comments during saving.
- prompt_overwrite:
bool, default = False
Wether or not to prompt when the output file already exists and is about to be overwritten. If False and the output file does already exist, file will be overwritten if possible.
- **kwargs:
Any keyword arguments accepted by matplotlib.pyplot.savefig()
unpack()
Extracts the files embedded in the PyPDF-file. Must be called before embedded files are read by the generating script. This can be guaranteed by importing the backend using pypdfplot.backend.unpack, which automatically calls unpack() with its default parameters. See Packing and unpacking for more details.
unpack(fname = None,
verbose = True)- fname:
str, default = None
Filename of the PyPDF file to unpack. If None, the filename of the currently executing script is taken.
- verbose:
bool, default = True
Wether or not to show verbose comments during extraction.
fix_pypdf()
Fixes PyPDF files that have been severed, e.g. because they were saved as ‘regular’ PDF-files outside of pypdfplot. See PyPDF compliance types for more details.
fix_pypdf(input_fname,
          output_fname = None,
verbose = True)- input_fname:
str
Filename of the severed PyPDF file
- output_fname:
str, default = None
Filename of the fixed output PyPDF file. If None, the input PDF file is overwritten.
- verbose:
bool, default = True
Wether or not to show verbose comments during fixing.
Packing and unpacking
In many cases you may want to plot data that is stored in a separate external file. In order for this to work, the external data file must be included, which can be achieved by packing and unpacking the data into the PyPDF file.
Packing files
In this section we show how to write a script that opens data from an external Excel file and reads the title and axis label from an extrnal text file, where both files are embedded in the PyPDF file.
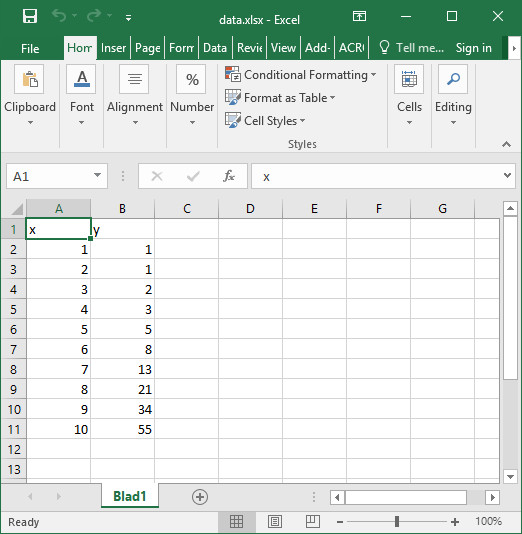
Create an excel file data.xlsx and fill the Excel file with data, e.g. the first 10 numbers of the Fibonacci sequence:
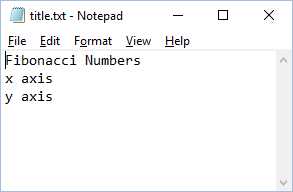
Next, create a text file title.txt and add names for the plot title and axes:
Finally, create a new python file packing.py that looks as follows:
import pypdfplot.backend.unpack
import matplotlib.pyplot as plt
import pandas as pd

df = pd.read_excel('data.xlsx')
plt.plot(df.x,df.y,'o')

with open('title.txt','r') as f:
    title = f.readline()
    xlabel = f.readline()
    ylabel = f.readline()

plt.title(title)
plt.xlabel(xlabel)
plt.ylabel(ylabel)

plt.savefig('packing.pdf',
            pack_list = ['data.xlsx',
                         'title.txt'],
            cleanup = True,
            )
By appending the filenames data.xlsx and title.txt to the pack_list list, the files will be embedded in the output PyPDF file.
Note that in order for this script to work, the next time it is ran these files must be extracted before Python attempts to open them. To make sure they are extracted before they are referenced, the PyPDF file can be unpacked immediately when the pypdfplot backend is loaded, by importing pypdfplot.backend.unpack instead of importing just pypdfplot.backend.
Finally, the keyword cleanup = True was passed to savefig() to toggle whether the external files will be removed (cleanup = True, default) or not (cleanup = False).
- Warning:
By passing cleanup = True (which is the default!), the local files are removed. If the original Python script without the files embedded is now ran again, an exception will be raised because the local files no longer exist. Therefore when cleanup = True is passed, the only way the script can be ran again is by opening the output PyPDF file, which has the external files embedded.
After running the script, the packing.py file is replaced by the output PyPDF file packing.pdf:
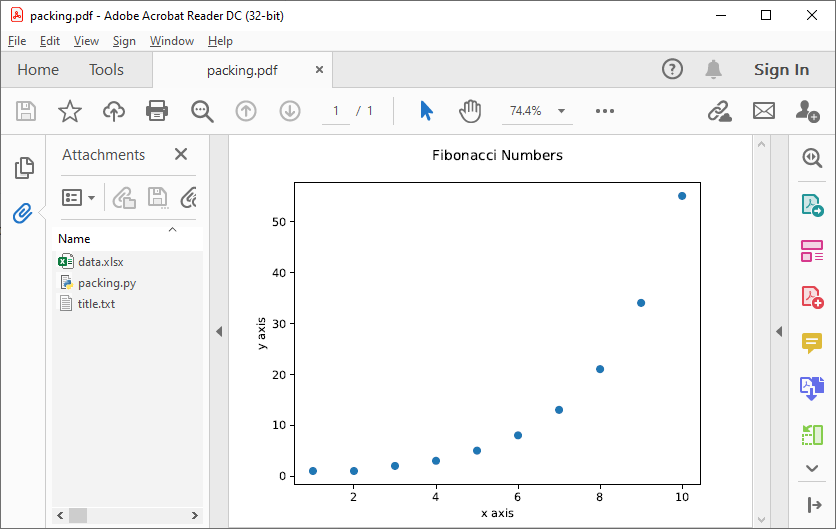
As can be seen in the “Attachments” list, the external files data.xlsx and title.txt have been embedded in the PyPDF file, in addition to the generating Python script.
Unpacking files
A PyPDF file that has files embedded must always be unpacked at the beginning of the script (see Packing files), so unpacking files is just a matter of not removing the files after they have been extracted.
This is done by simply passing the keyword argument cleanup = False.
Multiple plots
In some cases a single Python file may be generating multiple plots, e.g. in an iterative loop. This poses a challenge, because according to the pypdfplot philosophy, “the generating script is the plot” – but now there are multiple plots and only one generating script.
There are two options available to resolve this issue; in the first (default), the generating script (including the iterative loop), is embedded in the first PyPDF file. After that, following plots are pickled: the figure object is saved as external file, and a small script that reads the pickled figure is included as generating Python script in the PyPDF file. With this option, each plot is stored in a separate PyPDF file, and the iterative loop can be accessed by opening the first PyPDF file.
The second way is to add the multiple plots as multiple pages in a single PyPDF file. Because there is now only a single PyPDF file, there is no ambiguity in what file the generating Python script should be embedded.
Below each of the two options are detailed with an example.
Pickling
The way of handling multiple files can be selected with the keyword multiple. Since pickling is the default (multiple = 'pickle'), it does not have to be specified explicitly.
The code below generates plots of a linear, quadratic, and cubic function respectively:
import pypdfplot.backend
import matplotlib.pyplot as plt
import numpy as np
x = np.arange(-10,20,0.1)
for n in range(3):
y = x**(n+1)
plt.plot(x,y)
plt.savefig('plot{:d}.pdf'.format(n+1))
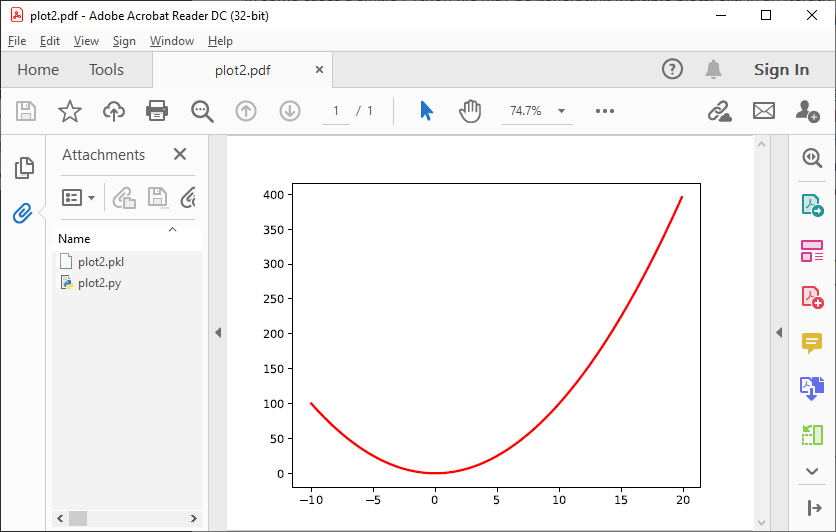
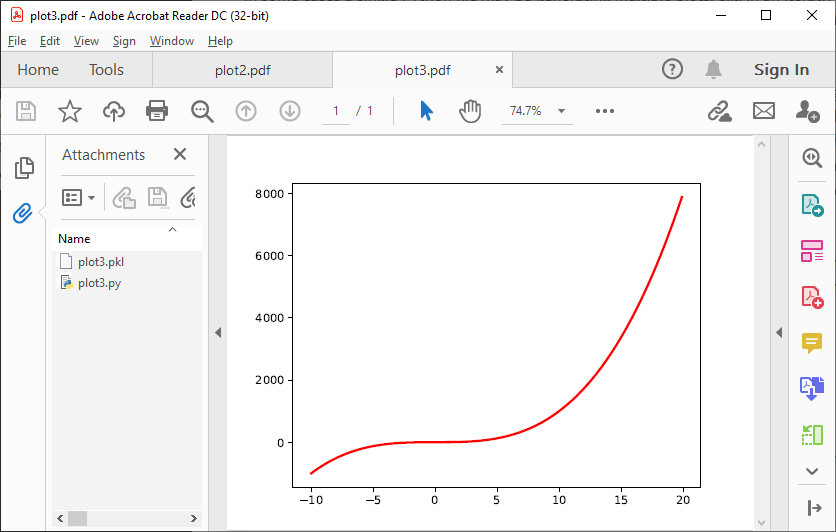
plt.clf()Which produces the following three plots:
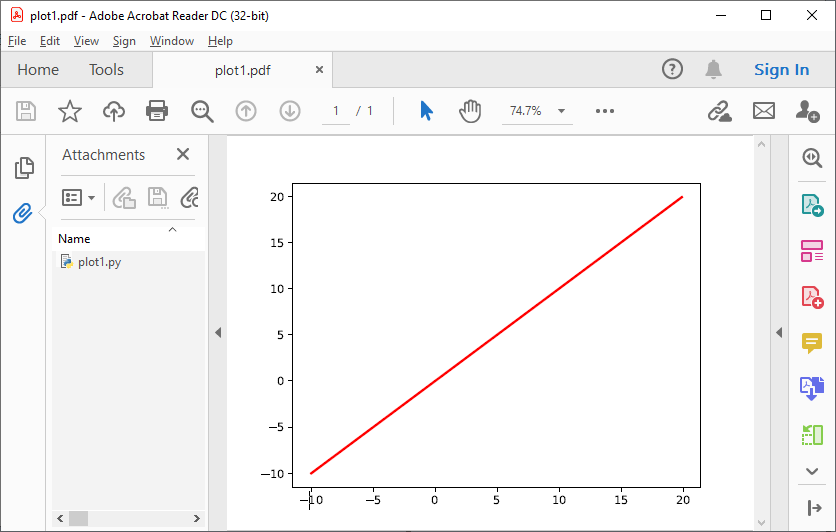
The first plot, plot1.pdf, has the original generating script embedded.
Plots plot2.pdf and plot3.pdf have their figure objects pickled, which are stored in plot2.pkl and plot3.pkl. By pickling their figure objects, the plots can still be modified by opening the PyPDF files in a text editor and running them as Python scripts.
The plot2.pdf file looks as follows when opened in a text editor:
#%PDF-1.4 26 0 obj << /Type /EmbeddedFile /Length        269 >> stream
import pypdfplot.backend.unpack
import matplotlib.pyplot as plt
from pickle import load

with open('plot2.pkl','rb') as f:
    fig = load(f)

plt.figure(fig.number)

## Plot customizations go here...

plt.savefig('plot2.pdf',
            pack_list = ['plot2.pkl'])

"""
--- Do not edit below ---
endstream
endobj
1 0 obj

<< ... >>

startxref
79815
%%EOF
0000080463 LF
PyPDF-1.0
"""
The individual plots can now be customized by modifying these generating scripts. By pickling the figure some flexibility is lost, but it should still be relatively straightforward to change e.g. line colors, font sizes, etc.
Pickling the figure can be advantageous even if it is not generated inside an iterative loop, for example if the generating script is very slow or relies on large external data files. By pickling the figure, the external files do not have to be re-processed and do not have to be embedded in the PyPDF file.
In such cases it is possible to force pypdfplot to pickle the plot by passing the force_pickle = True keyword to savefig().
Multiple pages
The other solution is to add the multiple plots to a single PyPDF file as multiple pages. This is done by calling savefig() with the multiple = 'add_page' keyword for every new plot, and finally calling savefig() one more time with the keyword multiple = 'finalize' to finalize the PyPDF file.
When the multiple = 'add_page' keyword is specified, every other argument to savefig() is ignored. The filename of the output PyPDF file is thus determined by the filename that is passed to the final savefig() call (with multiple = finalize), so an empty string can be passed for the calls with multiple = 'add_page'.
Any other arguments, such as the pack_list list, should also be passed to the finalizing savefig() call.
Revisiting the previous example, but this time adding the multiple plots as separate pages, the updated script looks as follows:
import pypdfplot.backend
import matplotlib.pyplot as plt
import numpy as np
x = np.arange(-10,20,0.1)
for n in range(3):
y = x**(n+1)
plt.plot(x,y)
plt.savefig('', multiple = 'add_page')
plt.clf()
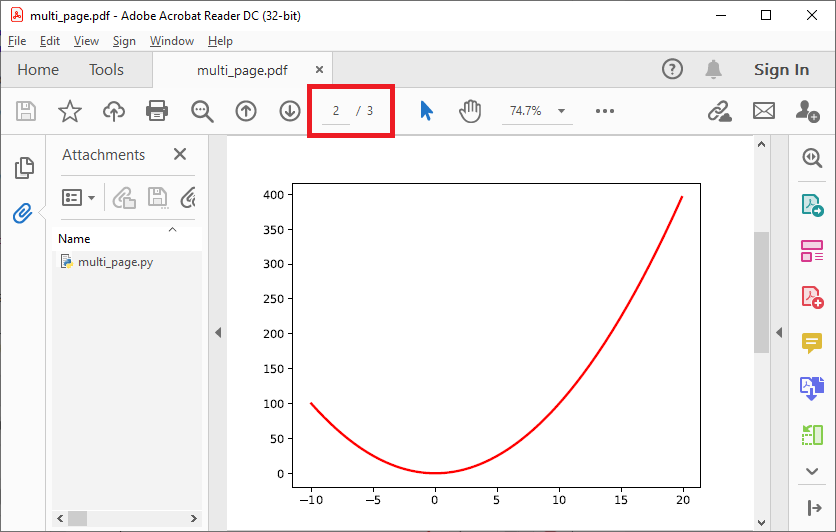
plt.savefig('multi_page.pdf', multiple = 'finalize')The output of this results in a single PyPDF file with three pages:
PyPDF file specification
This page describes the PyPDF file specification version 1.0
Motivation
A PyPDF file complies with the PDF specification and is additionally a valid Python file, in addition to meeting some other restrictions. Adhering to both file formats, the PyPDF file can be thought of as either a Python file with some extra restrictions to make it PDF compliant, or a PDF file with some extra restrictions to make it readable by a Python interpreter. Of the two file types, the PDF file has the most complex structure, so the simplest way to think of the PyPDF file is as a PDF file with extra restrictions.
In essence, a PyPDF file is a PDF file with the script that produced the PDF file embedded.
The PDF file structure consists of so called “blocks” which can be placed in arbitrary order in the PDF document. In order to pass as a PyPDF file, the block containing the filestream of the embedded generating script must be in ASCII (i.e. no encoding filter may be used) and must be the first object described in the document (the object number is not specified and can be chosen freely).
With these restrictions, the PDF file would so far look something like this:
%PDF-1.4
%öäüß
24 0 obj
<< /Type /EmbeddedFile /Length 187 >>
stream
import pypdfplot.backend
import matplotlib.pyplot as plt

<< ... >>
The characters on the second line, %öäüß, are usually included in a PDF file to indicate that we are dealing with a binary file as opposed to a ASCII file. However, in order to be a Python file it should be read as ASCII, so this line is simply omitted.
In the remaining first 4 lines (from %PDF to stream), all linebreaks are replaced by spaces so that there is only a single line preceding the generating Python script. This single line is then preceded by a pound sign (#) so that it is read as comment by the Python interpreter. The PDF specification states that the PDF header (%PDF) must appear within the first 1024 bytes of the document, so prepending the # is allowed within the PDF specification.
When the generating script is later modified, the length of its filestream will likely change. If the string of the new length is larger than the old string, all bytes in the document must be shifted to accomodate the increased size of the length string. In order to obviate this byte shift, the PyPDF file must leave some additional space between the /Length keyword and the number string. A total space of 10 digits is recommended.
The file now looks as follows:
#%PDF-1.4 24 0 obj << /Type /EmbeddedFile /Length        187 >> stream
import pypdfplot.backend
import matplotlib.pyplot as plt

<< ... >>
The filestream of the generating script consists of the generating Python script itself, in addition to a line with triple quotes ("""), followed by a linebreak, so that all PDF blocks that follow are read as a comment block by the Python interpreter, optionally followed by a warning string that warns the user against edits in the comment block:
#%PDF-1.4 24 0 obj << /Type /EmbeddedFile /Length        187 >> stream
import pypdfplot.backend
import matplotlib.pyplot as plt
import numpy as np

x = np.arange(-10,20,0.1)
y = x**2

plt.plot(x,y)
plt.savefig('example.pdf')

"""
--- Do not edit below ---
endstream
endobj
1 0 obj

<< ... >>
Because the use of non-ASCII binary characters is precluded in the PyPDF file, all stream objects in the PDF file must be encoded with one of the ASCII filters (either /ASCIIHexDecode filter or /ASCII85Decode filter).
Moreover, to remain PEP-compliant, lines may not exceed the length of 79 characters.
Finally, at the end of the PyPDF file some lines are added in addition to those specified by the PDF specification. A normal PDF file will end with the end-of-file marker %%EOF. The EOF marker must appear within the last 1024 bytes of the document, so it is allowed within the PDF specification to add a couple of lines after that.
Specifically, three lines are added after the PDF EOF marker:
The first line is a 10-digit integer with leading zeros giving the filesize in bytes, followed by a whitespace and LF or CRLF depending on which type of linebreaks were used to produce the document.
The next line contains the PyPDF version number in the format PyPDF-#.#, where the #’s are replaced by the major and minor version numbers.
Finally, a line with triple quotes ("""), followed by a linebreak, is added to close the comment block that was opened immediately following the generating script.
For example:
<< ... >>

startxref
9542
%%EOF
0000010149 LF
PyPDF-1.0
"""
By reporting the filesize inside the PyPDF file, the PDF xref table can be corrected after modification of the generating script in the PyPDF file (See PyPDF compliance types). Similarly, by explicitly stating which linebreak character was used (LF or CRLF), the PyPDF file can be repaired if the linebreaks were inadvertedly replaced.
As a final safety measure, the PyPDF file must identify the filename of the embedded generating script and specify what PyPDF version was used in the /Root object of the PDF file. This is done by specifying the /PyFile and /PyPDFVersion keys respectively in the dictionary of the /Root object:
<< ... >>

5 0 obj
<<
/Type /Catalog
/Pages 1 0 R
/PageMode /UseAttachments
/PyFile (example.py)
/PyPDFVersion (1.0)
>>

<< ... >>

trailer
<<
/Size 25
/Root 5 0 R
/Info 2 0 R
>>

<< ... >>
PyPDF file structure
The PyPDF file structure consists both of PDF and Python elements. While the PDF file structure is well documented in the PDF specification, in the PyPDF file certain functional elements blend into each other depending on if it is interpreted as PDF or as Python file. It is therefore useful to redefine the structural elements in the framework of the combined PyPDF file.
The PyPDF file can thus be considered as comprised of the following consecutive elements:
- PyPDF header:
A single line starting with #, followed by the %PDF header, followed by the filestream header of the embedded generating script, without any linebreaks. A 10-character wide space should be reserved for the value of the /Length keyword.
- Generating script:
The Python script that produces the PyPDF output. This element is itself a regular Python file without any PDF components. The generating script must end with a linebreak.
- PDF remainder:
The remainder of the PDF document, starting from the triple quotes as part of the filestream of the generating script, and ending at the %%EOF PDF end-of-file marker. By appending the PyPDF header, generating script, and the PDF remainder, not including the initial #, a regular PDF file is obtained. The PDF /Root object should contain /PyFile and /PyPDFVersion entries specifying the generating script and PyPDF version.
- PyPDF trailer:
A line with the 10-digit filesize in bytes including leading zeros, followed by a string specifying what linebreak character was used (LF/CRLF), followed by a new line with the PyPDF version number in the format PyPDF-#.#, followed by a new line with triple quotes, ending with a linebreak.
The following table identifies each of these elements in the example PyPDF file:
Element: |
Example: |
|---|---|
PyPDF header |
|
Generating script |
|
PDF remainder |
|
PyPDF trailer |
|
PyPDF compliance types
The first time a generating script is run, it does not have any PDF component yet and so it is technically not a PyPDF file. Still it is closer to a PyPDF file than most other odd Python file. Specifically, it can be easily turned into a PyPDF file by running the script.
In the same vain, during its life the PyPDF file may lose some compliance to the PyPDF specification in other ways that can be restored by running the generating script or external programs. This section discusses the different ways in which this can happen by identifying the different PyPDF compliance types. We distinguish 4 of these types:
- Generating script:
Pure Python file that lacks any PDF structure.
- Compliant PyPDF file:
Fully PyPDF compliant, both valid Python file and PDF compliant.
- Stale PyPDF file:
Mixed Python/PDF file that lost some PDF compliance.
- Severed PyPDF file:
Pure PDF file that lost its Python structure, but still has the generating script embedded.
The generating script and the compliant PyPDF file have both been discussed at length already. In the following the stale and severed PyPDF files will be discussed in more detail.
Stale PyPDF file
A Stale PyPDF file is a PyPDF file that lost its PDF compliance because the Python script was modified. This will happen whenever the Python script is updated and is therefore almost always intented. When the generating script – placed at the top of the document – is modified, the byte address of the following PDF blocks will shift. Because of this shift, the xref-table at the end of the PDF document is compromised, resulting in the file losing its PDF compliance.
The adresses in the xref-table are only off by a constant shift, so if the size of this shift could be obtained, the xref-table could be corrected and the file made PyPDF compliant once again. To facilitate retrieval of the address shift, the filesize in bytes is printed in the PyPDF trailer. By comparing the recorded filesize with the current filesize, the shift can be determined and the xref-table corrected. This correction is applied every time the savefig() function is called with the pypdfplot backend loaded. This means that converting a stale PyPDF file to a compliant PyPDF file is done by simply running the script.
For correcting the xref-table it is assumed that the corruption was the result of the Python script changing in size. Another process by which the xref-table may be corrupted, is that UNIX linebreaks are inadvertedly replaced by Windows linebreaks or vice versa. This can happen e.g. when the PyPDF file is committed to a Github repository, without PDF-files being explicitly set to binary files.
Safeguards are in place to correct for this as well: The PyPDF file must specify what linebreak it used in the PyPDF trailer and must use this linebreak character consistently throughout the document. A correction procedure can compare the reported linebreak character with the ones found in the file and correct if necessary. This correction should be performed before correcting for the change in size of the generating script.
Severed PyPDF file
A severed PyPDF file is a PyPDF file that lost its Python structure, usually because it is saved by a PDF reader that is unaware of the PyPDF file format. There is normally no reason the PyPDF file should lose its Python structure, and when it does it is usually unintended. Just like the stale PyPDF however, there are some builtin safeguards to convert the severed PyPDF back into a compliant PyPDF file.
Since the severed PyPDF is still PDF compliant, it only needs to be restructured with the following two basic rules: the generating Python script (which is must still embedded in the PDF file) has to be placed on top, and only ASCII characters may be used in writing the corrected document. To figure out which embedded file is the generating script, a PyPDF file must always specify the filename of the generating script with the /PyFile key in the PDF /Root dict.
A severed PyPDF file can be fixed by passing its filename to fix_pypdf() in a Python script:
from pypdfplot import fix_pypdf
fix_pypdf('severed_pypdf.pdf','compliant_pypdf.pdf')
The fix_pypdf command can also be ran from the command line.
The different compliance types and how they can be converted into fully compliant PyPDF files are summarized in the figure below:

Changelog
v0.6.5 - Previous patch introduced a new problem with the “Do not edit below” string. This is now solved.
v0.6.4 - Prevent deletion of output when input is .pdf - Fixes additional PyPDF4 compatibility issues
v0.6.3
Fix compatibility with PyPDF4 v1.27.0
v0.6.2
Fix missing installation of backend
Fix some links in docs
v0.6.1
Documentation completely updated
Removed legacy publish() function, only works as Matplotlib backend now.
Changed auto_extract() to unpack()
Changed file_list to pack_list
Added __PYPDFVERSION__ as canonical version no.
Added pw.setPyPDFVersion() to fix_pypdf()
v0.6.0
First official release
Release history Release notifications | RSS feed


Download files
Download the file for your platform. If you're not sure which to choose, learn more about installing packages.
Source Distribution
Built Distribution
Hashes for pypdfplot-0.6.5-py2.py3-none-any.whl
| Algorithm | Hash digest | |
|---|---|---|
| SHA256 | 3d1aa3405e8e047429b1bb281bcad66f6b713664c26723d1104935b9ed211f56 |
|
| MD5 | a1046fe8709aeee8b80e66778ddb5ae4 |
|
| BLAKE2b-256 | f7e57eb4fed1c7951db0bf03c1b86e792ec8af2c1adece8dc1d16d118813fdbf |


