Saves plots as PDF with embedded generating script

Project description
Overview
The pypdfplot package provides a backend to Matplotlib that generates a PDF file of the plot with the generating Python script embedded.
Although Matplotlib is a very powerful and flexible plotting tool, once a plot is saved as PNG or PDF file, the link between the plot and its generating Python script is lost. The philosophy behind pypdfplot is that there should be no distinction between the Python script that generates a plot and its output PDF file, much like there is no such distinction in an Origin or Excel file. As far as pypdfplot is concerned, the generating script is the plot.
When the backend is loaded and a figure is saved using plt.savefig(), the generating Python script is embedded into the output PDF-file in such a way that when the PDF file is renamed from .pdf to .py, the file can be read by a Python interpreter without alteration. The script can then be edited at will to implement changes in the plot, after which the script is ran again to produce the updated PDF file of the plot – including the updated embedded generating script.
The resulting file, which is both a Python file and a PDF-file, is conveniently called a PyPDF-file.
To learn more about how to use pypdfplot, continue with reading the Quickstart, or check out the commented examples in the examples folder.
Installation
Via Python Package
Install the package from the PyPI repository opening a command prompt and enter:
pip install pypdfplotVia Git or Download
Alternatively, the source files can be downloaded directly from the GitHub repository. After downloading the source files, navigate to the project directory and install the package by opening a command prompt and enter:
python setup.py installQuickstart
The pypdfplot package provides a backend for Matplotlib for producing PyPDF-files. This section goes through a basic example that shows how to use pypdfplot.
Simple Example
For this example, the goal is to produce a red plot of the quadratic function from -10 to 20. To start off, you first plot this in the conventional way using Matplotlib.
Create a new python file, let’s call it example.py.
Open the file and enter the following script:
import matplotlib.pyplot as plt
import numpy as np

x = np.arange(-10,20,0.1)
y = x**2

plt.plot(x,y,'r')
plt.savefig('example.pdf')
After running this script, you should get the following figure:

To produce a PyPDF-file, all you have to do is add a line on the top to import the backend:
import pypdfplot.backend
import matplotlib.pyplot as plt
import numpy as np

x = np.arange(-10,20,0.1)
y = x**2

plt.plot(x,y,'r')
plt.savefig(example.pdf)
After running this script, if you look in the folder where the example.py file once was, you’ll notice it has been replaced by a new file example.pdf. Of course the fact that the example.py file disappeared doesn’t mean the script is gone – it is now embedded in the PyPDF file example.pdf!
You can find evidence of this by opening the example.pdf file:

The table on the left shows all files that are embedded, and clearly example.py is there.
Most versions of Acrobat reader don’t allow the embedded .py file to be opened for security reasons. To access the python script, rename example.pdf to example.py and open the file. This is what you should find:
#%PDF-1.3 23 0 obj << /Type /EmbeddedFile /Length 124 >> stream
import pypdfplot.backend
import matplotlib.pyplot as plt
import numpy as np

x = np.arange(-10,20,0.1)
y = x**2

plt.plot(x,y,'r')
plt.savefig('example.pdf')

"""
endstream
endobj
1 0 obj

<...>

startxref
8829
%%EOF
0000009410
PyPDF
"""
The first line is the PDF header that helps the PDF reader to determine this is a valid PDF file. It also includes the object header for the EmbeddedFile object of our example.py file. This line may not be altered, as it will result in corruption of the PyPDF file.
What follows is the original python script, followed by a large multiline string. This multiline string contains all the PDF objects including the data for any remaining embedded files (see PyPDF File specification). Making any edits in this string will again likely result in corruption of the file, so it is strongly discouraged.
In between the first line and the multiline string is the original python script, which may be edited in any way. For example, let’s give the plot a title and change the color to blue:
#%PDF-1.3 23 0 obj << /Type /EmbeddedFile /Length 124 >> stream
import pypdfplot.backend
import matplotlib.pyplot as plt
import numpy as np

x = np.arange(-10,20,0.1)
y = x**2

plt.plot(x,y,'b')
plt.title('Blue Example')
plt.savefig('example.pdf')

"""
endstream
endobj
1 0 obj

<...>

startxref
8829
%%EOF
0000009410
PyPDF
"""
Again, after running the script the example.py file is replaced by the example.pdf file. When you open example.pdf, you should find the updated blue plot with caption:

savefig() keywords:
The behaviour of the plt.savefig() function can be altered through the use of the following keywords. Default values are given in brackets.
output_fname (str) default = None – Filename of the output file. If None, the filename of the python file is used with extension .pdf.
file_list (list) default = [] – List with filenames that will be embedded in the PyPDF-file. The generating script is added separately and should not be included here.
cleanup (bool) default = True – Whether or not to cleanup files that have been embedded in the PyPDF file. Set to False and run script to extract embedded files.
multiple (str) default = ‘pickle’ – How to handle multiple plots in a single generating script. Can be any of ‘pickle’, ‘add_page’, or ‘finalize’. See section XXX for more details
force_pickle (bool) default = False – Pickles the figure and embeds a Python script that unpickles and reads the figure again. This can be useful when dealing with very large source files, see section XXX for more details.
verbose (bool) default = True – Wether or not to show verbose comments during publication.
prompt_overwrite (bool) default = False – Wether or not to prompt when the output file already exists and is about to be overwritten. If False and the output file does already exist, pypdfplot will overwrite the file if possible.
kwargs – Any other keyword arguments are passed to matplotlib’s savefig function.
Embedding Files
In many cases you may want to plot data that is stored in a separate file. In order for this to work, the external data file must be included in the PyPDF file as well. What follows is an example how to embed external files with pypdfplot.
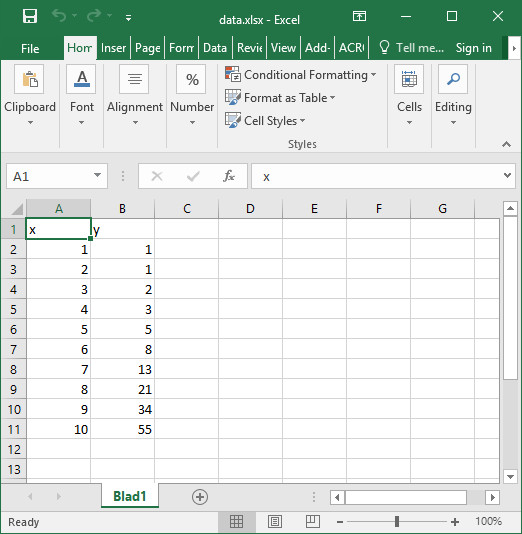
We will write a script that opens data from an external excel file and reads the title and axis label from an extrnal text file.
Create an excel file called data.xlsx. For this example, fill the file with the first 10 numbers of the Fibonacci sequence:
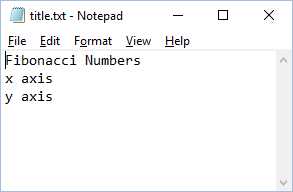
Then create a text file with our title and axis labels called title.txt:
Finally, create a new python file called packing.py.
As before, let’s first have a look at how this script would look without the pypdfplot backend. We will use Pandas to import the Excel file into Python. Open packing.py and enter the following script:
import matplotlib.pyplot as plt
import pandas as pd

df = pd.read_excel('data.xlsx')
plt.plot(df.x,df.y,'r.')

with open('title.txt','r') as f:
    title = f.readline()
    xlabel = f.readline()
    ylabel = f.readline()

plt.title(title)
plt.xlabel(xlabel)
plt.ylabel(ylabel)

plt.savefig('packing.pdf')
After running this script, the following figure should pop up:

In order to use pyplotpdf to save the figure as a PyPDF file, change add the import for pypdfplot.backend as before. Additionally, you must make sure that the embedded files are available for the python script when it is run again next time. To do this, the embedded files must be extracted before they are read, ideally even before matplotlib is loaded. This can be done by importing pypdfplot.backend.auto_extract instead of just pypdfplot.backend.auto_extract
Additional files can be embedded in the PyPDF file by appending their filenames to a list and passing the list to plt.savefig() as the file_list keyword argument.
By setting the keyword cleanup = True in the plt.savefig() function, the local files will be deleted after they are successfully embedded in the PyPDF file.
The script now looks as follows:
import pypdfplot.backend.auto_extract
import matplotlib.pyplot as plt
import pandas as pd

df = pd.read_excel('data.xlsx')
plt.plot(df.x,df.y,'r.')

with open('title.txt','r') as f:
    title = f.readline()
    xlabel = f.readline()
    ylabel = f.readline()

plt.title(title)
plt.xlabel(xlabel)
plt.ylabel(ylabel)

plt.savefig('packing.pdf',
            file_list = ['data.xlsx',
                         'title.txt'],
            cleanup = True)
After running the script, the output file packing.pdf is generated and all three files packing.py, data.xlsx, and title.txt, are deleted after being embedded in packing.pdf. This can be confirmed by opening packing.pdf:

To maximize integration with Matplotlib, the PyPDF file is checked for embedded files at the time the pypdfplot package is imported. If embedded files are found, they are extracted provided there are no local files with the same filename. If a local file is found with the same filename, it is assumed this is a more recent version (e.g. a file that was extracted and then updated), and should therefore have precedence over the embedded file.
In case you want to keep the files that are extracted from the PyPDF file, simply set the keyword cleanup = False.
Editing Embedded Files
There are two ways embedded files can be edited or updated: The Python way or the PDF way. Editing files via the Python way is encouraged, but using PDF should also work.
The Python way
Exctract all embedded files from the PyPDF file by renaming the file to the .py extension, and running the Python script with the cleanup keyword set to False.
Edit the local file
Run again to embed the updated files. If so desired, the cleanup = True keyword can be used again to remove all local files.
When pypdfplot tries to exctract the outdated files from the pypdf file, it will check for local copies. If a local copy is present, it will assume it is a more recent version and will not extract the outdated embedded file.
The PDF way
In the PDF viewer (in most cases, this is Adobe Acrobat), double click on the embedded file you wish to edit to open it.
Edit the file and save it. It will be saved as a local copy in the PDF viewer.
Save the PDF file
Because the PDF file was saved by a viewer that is unaware of the PyPDF file format, the format is severed. Assuming your filename is pdf_file.pdf, run the following script to convert the PDF file back to PyPDF:
from pypdfplot import fix_pypdf
fix_pypdf('pdf_file.pdf')
alternatively, the command-line tool can be used:
fix_pypdf pdf_file.pdfPyPDF File specification
This document is work in progress
Description of the PyPDF file specification
Functions
This document is work in progress
Description of the functions
Classes
This document is work in progress
Description of the two classes
Changelog
Here we list all changes
Release history Release notifications | RSS feed


Download files
Download the file for your platform. If you're not sure which to choose, learn more about installing packages.
Source Distribution
Built Distribution
Hashes for pypdfplot-0.6.0-py2.py3-none-any.whl
| Algorithm | Hash digest | |
|---|---|---|
| SHA256 | 29b7cc1ddcd136bffc98df0cf89575a3faba936664f7a1328dea1da28ac0fd83 |
|
| MD5 | 1b0bb42a9d41e85e32ce60a1bdcd149a |
|
| BLAKE2b-256 | 833ade901e680ad6a177d287cfee30e863481fa04af7f6b3a416703a523c1806 |


