Simple web application to visualize and compare genomes in Genbank files

Project description
GBKviz: Genbank Data Visualization WebApp


Overview
GBKviz is a web-based Genbank data visualization and comparison tool developed with streamlit web framework. GBKviz allows user to easily and flexibly draw CDSs in user-specified genomic region (PNG or SVG format is available). It also supports drawing genome comparison results by MUMmer. GenomeDiagram, a part of BioPython module, is used to draw the diagram. This software is developed under the strong inspiration of EasyFig.
If you are interested, click here to try GBKviz on Streamlit Cloud.
:warning: Due to the limited resources in Streamlit Cloud, it may be unstable.
Installation
GBKviz is implemented in Python3 (Tested on Ubuntu20.04)
Install PyPI stable version with pip:
pip install gbkviz
If you want to enable genome comparison in GBKviz, MUMmer is required.
Install MUMmer with apt command (Ubuntu):
sudo apt install mummer
GBKviz can also be available with Docker:
docker pull moshi4/gbkviz:latest
docker run -d -p 8501:8501 moshi4/gbkviz:latest
Dependencies
-
Streamlit
Simple web framework for data analysis -
BioPython
Utility tools for computational molecular biology -
MUMmer
Genome alignment tool for comparative genomics
Command Usage
Launch GBKviz in web browser (http://localhost:8501):
gbkviz_webapp
If you are using Docker to start, above command is already executed.
Example
Example of GBKviz genome comparison and visualization results.
Fig.1: 4 phage whole genomes comparison result
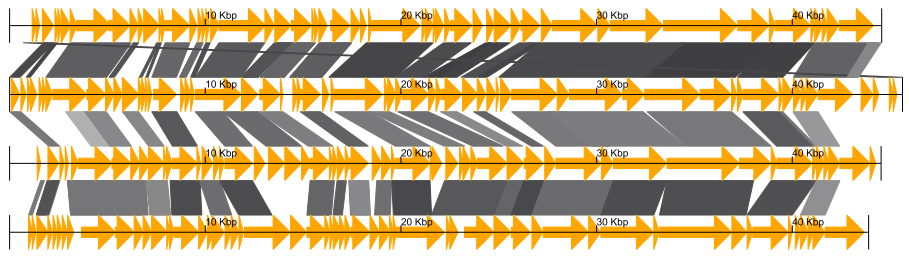
Fig.2: 4 E.coli partial genomes comparison result
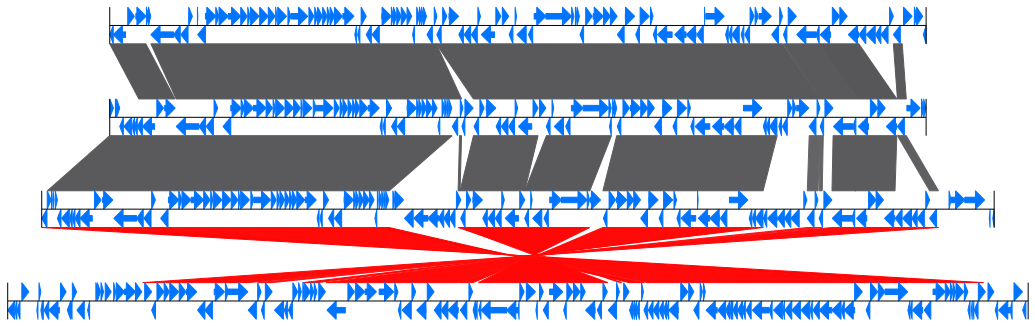
Fig.3: 4 E.coli whole genomes comparison result
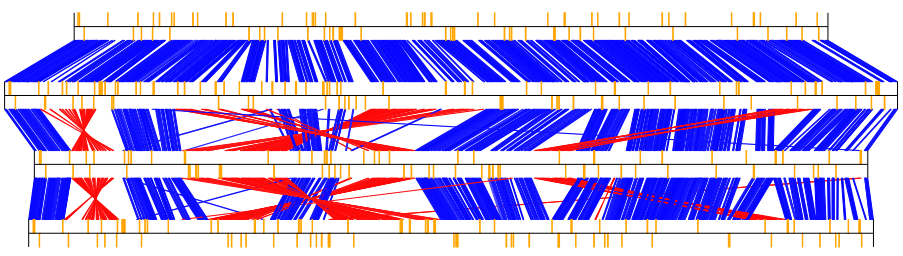
Fig.4: Simple CDS visualization with gene label

Genome Comparison
In GBKviz, MUMmer is used as genome comparison tool.
Following four genome comparison methods are available.
- Nucleotide One-to-One Mapping
- Nucleotide Many-to-Many Mapping
- Protein One-to-One Mapping
- Protein Many-to-Many Mapping
User can download and check genome comparison results file.
Genome comparison results file is in the following tsv format.
| Columns | Contents |
|---|---|
| REF_START | Reference genome alignment start position |
| REF_END | Reference genome alignment end position |
| QUERY_START | Query genome alignment start position |
| QUERY_END | Query genome alignment end position |
| REF_LENGTH | Reference genome alignment length |
| QUERY_LENGTH | Query genome alignment length |
| IDENTITY | Reference and query genome alignment identity (%) |
| REF_NAME | Reference genome name tag |
| QUERY_NAME | Query genome name tag |


